Intake manifold length on a two-stroke: what a longer or shorter tract does
WaveDyno tutorial 15, about 10 minutes plus three sweeps.
Change the manifold between the carburettor and the crankcase and the power curve changes too. Ask which way it moves for a longer or a shorter one and the usual answer is that a longer tract helps low down and a shorter one helps up top. WaveDyno's own tooltip on the intake duct says the same thing: "longer tracts move the ram peak down the rev range." This guide tests that on the app's default engine. It lengthens the intake duct, then shortens it, sweeps each version and shows what moved, with every step there for you to rerun.
The short answer, in this model, on this engine:
- A longer tract moved power down the rev range. At 200 mm instead of 120, the engine made 3.02 kW (23.5 %) more at 9,500 rpm, still 0.26 kW more at 10,750, and 0.24 to 0.88 kW (up to 2.9 %) less from 11,250 to 12,750. It came off the pipe at the same point as the template, between 13,000 and 13,250 rpm.
- A shorter tract did the opposite, at a price. At 80 mm it made 0.46 to 2.49 kW less at every point from 9,500 to 12,750 rpm, then 1.38 kW (3.9 %) more at 13,000, and in our sweep it stayed on the pipe two steps longer, to 13,500.
- Low down, the longer tract pushed less mixture back out of the intake. That's in the dyno's blowback chart. Through the middle, where it lost, less mixture came in at all.
What the page can't answer:
- What length your manifold should be. The tract in WaveDyno is a plain pipe of one diameter, with no carburettor, no taper and no bend in it. The results are directions on one model engine, not a length for a real one.
- What your engine will do. The example is the app's 125 road race archetype, a disc-valve 125 with a tuned pipe. It isn't anyone's actual bike, scooter or kart, and the model isn't calibrated against a dyno. A reed or piston-port engine, a different pipe or a different carb can answer differently.
- Jetting. The model holds the mixture fixed, so every run here has the same mixture. It doesn't model what a different manifold does to carburation, and this page gives no advice on jetting or carburation.
Everything here runs on WaveDyno's free plan with daily run limits. There are three full sweeps of 19 points. The Run dyno button showed 16.3 to 18.1 units for each, and a finished sweep is charged what it actually used, up to its estimate; ours were charged 8.2 to 8.6 units each. In our runs, on a day with nothing else run, all three fit in one day's allowance. The app refuses a run whose estimate doesn't fit in what's left of the day, so if you've already run something today, follow the remaining allowance the app shows. The limit resets at midnight UTC, and your runs stay in the project, so you can pick up where you stopped.
How the model sees the intake
WaveDyno can model the intake two ways: as a single opening straight to the atmosphere, or as a 1D duct, a pipe in which the gas moves and pressure waves travel, just as they do in the exhaust. The 125 road race template uses the duct.
That duct is simple on purpose:
- One diameter all the way. It's the Port effective diameter on the Ports tab, 42 mm here. There's no carburettor body, venturi, slide or taper in it.
- An open end at the atmosphere. The app adds a short end correction there, as it does at the stinger's mouth, so the air just outside the bellmouth moves with the column. The duct's Duct length is the physical length; the end correction is on top of it.
- The crankcase at the other end, behind the intake valve. On this engine that's a rotary disc, timed by the crank: it opens 165° before top dead centre and closes 85° after.
The length matters because the column of air in the duct has mass and a pressure wave runs up and down it. That's the same idea as the exhaust pipe in How an expansion chamber works: a wave takes a set time to travel the duct, so it helps or hinders at the valve depending on the rpm. A longer duct rings more slowly, so its useful timing comes at lower rpm. That's the usual explanation and the tooltip's. These runs show the result in the power curve; they don't show the wave in the duct.
The engine
Create a new project with the setup wizard (the + button next to the project name, as in tutorial 1). The wizard starts on 125 road race: keep it, keep every answer at its default, give the project a name and create it. The intake step shows a Rotary disc with a 42 mm inlet and a 120 mm tract.
It's the wizard's default engine, and this is the first tutorial to use it as it comes: a liquid-cooled 125 with a rotary-disc intake, transfer ducts and a road-race expansion chamber. The Engine tab shows one note from the start: "Mean piston speed reaches 25.4 m/s at 14,000 rpm — above the ~25 m/s road-engine norm." It's a durability note, it's there for every run on this page, and none of the changes here adds or removes a warning.
The template's own sweep is 11,000 to 14,000 rpm in 500 rpm steps. Widen it: on Run → Setup, set From 9500, To 14000, Step 250, quality Standard. That's 19 points. Keep it the same for every run here: Compare only shows a delta where both runs have the same rpm (Compare two pipes).
Check the intake before you run. On Build → Ports → Intake port: Port type Rotary disk, Port effective diameter 42 mm, Rotary opens 165 °BTDC, Rotary closes 85 °ATDC, and the line intake duration 250°. On Build → Ducts, the Intake duct card: 1D intake duct on, Duct length 120 mm. Open Model calibration (advanced) under it: Cell size Δx reads 5.00 mm (its tooltip says 24 cells), and the end correction reads Auto, "Applied δ ≈ 17.3 mm at the Ø 42 mm mouth".
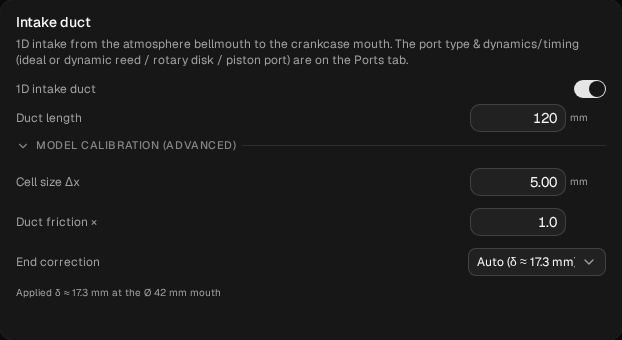
baseline: the Intake duct card, with the 1D intake duct on, the duct 120 mm long, and Model calibration (advanced) open.Run the sweep, open Compare and name the run baseline. In ours every point converged. It climbs to 12,750 rpm, holds most of it at 13,000, and falls off the pipe between 13,000 and 13,250, losing 52 % of its power in that one step.
Before each change below, restore the baseline: Compare → the restore icon on baseline → Restore settings. Then check that Diff inputs against baseline is empty. Every change is made from the baseline, not from the run before it.
1. A longer tract: 120 → 200 mm
On Build → Ducts, in the Intake duct card, change Duct length from 120 to 200. Nothing else.
Check before you run:
- Cell size Δx still reads 5.00 mm; its tooltip now says 40 cells. The end correction stays at δ ≈ 17.3 mm: it follows the diameter, not the length. The app keeps the cell size and adds cells to fill the longer duct. The estimate on the Run dyno button goes up a little (16.9 to 18.1 units in ours).
- Compare → Diff inputs against
baselinelists two lines:Intake / Pipe Elements24 → 40 andIntake / Pipe Length0.12 → 0.2 (in metres). The cell count follows the length; nothing else changed.
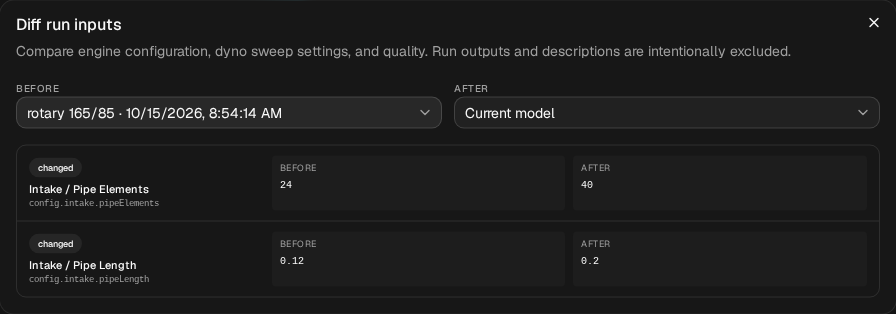
rotary 165/85 in our project.Run it, name it tract 200, and in Compare set baseline as the baseline.
| rpm | baseline kW | tract 200 kW | change |
|---|---|---|---|
| 9,500 | 12.877 | 15.901 | +3.024 (+23.5 %) |
| 9,750 | 16.641 | 18.915 | +2.274 (+13.7 %) |
| 10,000 | 19.157 | 20.444 | +1.287 (+6.7 %) |
| 10,500 | 21.970 | 22.557 | +0.587 (+2.7 %) |
| 10,750 | 23.426 | 23.683 | +0.257 (+1.1 %) |
| 11,000 | 24.892 | 24.779 | −0.113 (−0.5 %) |
| 11,500 | 28.478 | 27.695 | −0.783 (−2.7 %) |
| 11,750 | 30.514 | 29.630 | −0.884 (−2.9 %) |
| 12,250 | 34.049 | 33.519 | −0.530 (−1.6 %) |
| 12,750 | 36.200 | 35.958 | −0.242 (−0.7 %) |
| 13,000 | 35.273 | 35.681 | +0.408 (+1.2 %) |
| 13,250 | 16.909 | 15.964 | (both off the pipe) |
Italics: off the pipe. Every point of both runs converged.
What moved, reading only where both runs are on the pipe (9,500 to 13,000):
- More at the bottom. It was ahead at every point from 9,500 to 10,750: by 3.02 kW at 9,500, shrinking step by step to 0.26 kW at 10,750.
- Level at 11,000, then behind. It was within 0.11 kW at 11,000, then behind at every point from 11,250 to 12,750, by 0.24 to 0.88 kW, most at 11,750.
- The same fall-off. Both came off the pipe between 13,000 and 13,250 rpm. At 13,000 the template is already a little past its best and the longer tract is 0.41 kW ahead; that's the last point before both drop, so read it as part of the edge, not as a second band.
That's the tooltip's claim, on this engine: gains low, losses higher up, with the crossover at about 11,000 rpm.
Why, in the numbers
Switch Compare's lower chart to blowback. It plots how much of the mixture that came in through the intake went back out of it, as a percentage, each cycle. The disc is two-way whenever it's open, so some mixture always goes back out.
- From 9,500 to 10,750, the longer tract almost stopped it. The template pushed 7.7 to 9.9 % of its intake charge back out; the 200 mm tract, 0.2 to 2.1 %. At 9,500 rpm it also drew 22.5 mg more mixture in per cycle. That's where it gained.
- Through the middle, it drew in less. From 11,250 to 12,750 the 200 mm tract took in 2.7 to 18.5 mg less mixture per cycle than the template, and its delivery ratio was lower. Up to 12,250 it also pushed back less, so the loss there isn't blowback; it's less mixture coming in at all.
The CSV has these columns (returned_mass_fraction, intake_forward_mass_mg, delivery_ratio) if you want the figures behind the chart.
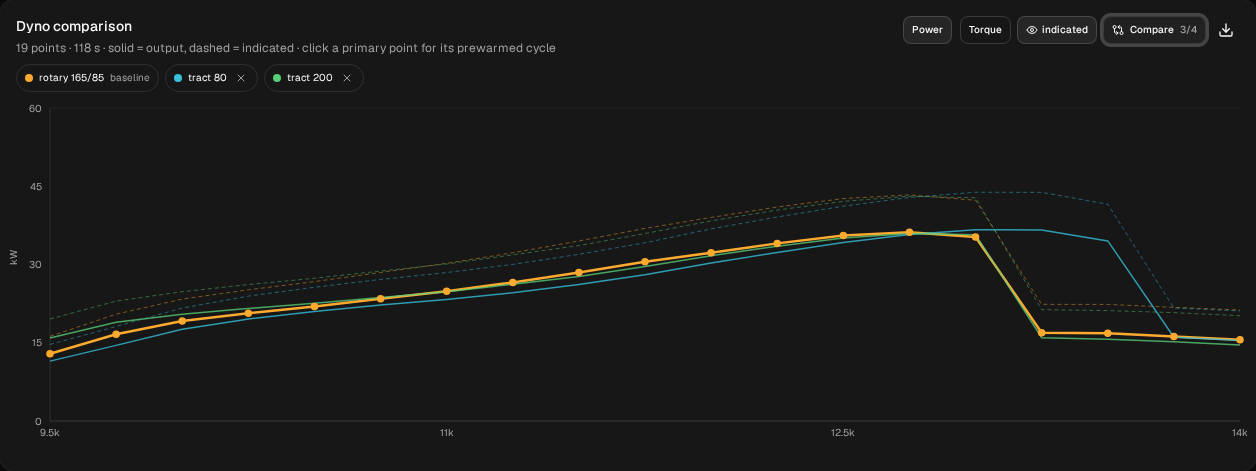
tract 200, tract 80 and baseline, with the same sweep settings. The baseline run is named rotary 165/85 in our project.
rotary 165/85 in our project.2. A shorter tract: 120 → 80 mm
Restore baseline. Change Duct length from 120 to 80. Nothing else. Cell size Δx still reads 5.00 mm, now 16 cells, and Diff inputs lists the same two lines, to 16 and 0.08. The button showed 16.3 units. Run it and name it tract 80.
| rpm | baseline kW | tract 80 kW | change |
|---|---|---|---|
| 9,500 | 12.877 | 11.479 | −1.398 (−10.9 %) |
| 9,750 | 16.641 | 14.494 | −2.147 (−12.9 %) |
| 10,500 | 21.970 | 20.971 | −0.999 (−4.5 %) |
| 11,000 | 24.892 | 23.290 | −1.602 (−6.4 %) |
| 11,750 | 30.514 | 28.021 | −2.493 (−8.2 %) |
| 12,500 | 35.538 | 34.212 | −1.326 (−3.7 %) |
| 12,750 | 36.200 | 35.743 | −0.457 (−1.3 %) |
| 13,000 | 35.273 | 36.651 | +1.378 (+3.9 %) |
| 13,250 | 16.909 | 36.633 | (one on the pipe, one off) |
| 13,500 | 16.797 | 34.521 | (one on the pipe, one off) |
| 13,750 | 16.175 | 16.057 | (both off the pipe) |
Italics: off the pipe. Every point of both runs converged.
What moved:
- Less from 9,500 to 12,750. It was behind at every one of those 14 points, by 0.46 to 2.49 kW: by about 10 to 13 % at 9,500 and 9,750, 4.5 to 8.2 % from 10,000 to 12,250, and less above that.
- More at 13,000, by 1.38 kW.
- On the pipe longer. It came off between 13,500 and 13,750, two steps later than the template's 13,000 to 13,250. At 13,250 and 13,500 it was still on the pipe while the template was off it.
- More blowback everywhere. It pushed 11.2 to 16.6 % of its intake charge back out from 9,500 to 10,750, and 4.9 to 9.7 % from 11,000 to 13,000: 3.4 to 7.7 points more than the template at every point to 13,000. It also drew in 4.1 to 18.6 mg less mixture per cycle from 9,500 to 12,750.
So the shorter tract moved the band the other way, as the tooltip says, but on this engine it paid for the extra top end over almost the whole sweep below it.
Read the fall-off as a bracket, not an exact rpm. The model shows falling off the pipe as a sharp step, about half the power in one 250 rpm step. Near that edge this kind of engine can run two ways, and where a rising sweep leaves the pipe depends partly on how it got there (Pipe temperature, section 3, shows it on the moto-X engine). Both sweeps here rise from 9,500 the same way, so they compare like with like; a sweep started higher up can come off sooner.
All three runs
| Run | Duct length | Against baseline, where both are on the pipe | Falls off the pipe between |
|---|---|---|---|
baseline | 120 mm | 13,000 and 13,250 | |
tract 200 | 200 mm | +0.26 to +3.02 kW from 9,500 to 10,750; −0.24 to −0.88 kW from 11,250 to 12,750 | 13,000 and 13,250 |
tract 80 | 80 mm | −0.46 to −2.49 kW from 9,500 to 12,750; +1.38 kW at 13,000 | 13,500 and 13,750 |
These runs use the app's default mesh. On this engine the top of the band is sensitive to the exhaust mesh: from 12,000 rpm up, a finer mesh moves the absolute figures by 2 to 7 % and the fall-off by a step. Every run here uses the same mesh, so the comparisons are like for like, which is why this page gives differences rather than a peak figure. The longer tract's losses from 12,000 up (0.24 to 0.58 kW) are smaller than that sensitivity. This engine is not mesh-converged from 12,000 rpm up, and we haven't repeated these comparisons on a finer mesh, so their size, or even their direction, may change. Take them as what the default mesh shows.
What it adds to tutorial 7
Reed vs piston port vs rotary disc switched a 50 cc engine's intake between the three valve types and found the disc pushing a lot of mixture back out low down. This page keeps the disc and its timing and changes only the duct in front of it. On this 125, the duct's length alone moved the blowback from 9,500 through 10,750 rpm, from 7.7–9.9 % of the intake charge to 0.2–2.1 % (200 mm) or 11.2–16.6 % (80 mm).
What to take from it
On this model, with this engine:
- A longer intake tract moved power down the rev range, a shorter one up, as the app's tooltip says. 200 mm gained up to 3.02 kW below 11,000 rpm and lost up to 0.88 kW above it; 80 mm lost up to 2.49 kW below 13,000 and held the pipe two steps longer.
- The trade wasn't even. The longer tract's gains low down were bigger than its losses higher up. The shorter tract's gain at the top cost power at every point below 13,000.
- The 200 mm tract's gains from 9,500 to 10,750 rpm came with less blowback, and its losses through the middle with less mixture drawn in.
Those are answers for one engine that you can check, not rules. To get them for yours:
- Enter your own engine with the setup wizard, sweep it, then change only Duct length, a step each way, from the same baseline. Check with Diff inputs before you run: two lines, the length and the cell count.
- Read the blowback chart with the power chart. On this engine, the tract moved blowback as much as power.
- Treat any fall-off as a bracket, and compare sweeps that start at the same rpm.
If you've run two manifolds on the same engine and have dyno sheets for both, join the tester programme. That comparison is what we most want to see.
These are simulated estimates from a 1D gas-dynamics model of a generic engine, not measurements, and not your engine. The model isn't calibrated against a dyno, and even the differences between the runs hold only for this model. Its intake duct is a straight pipe of one diameter with no carburettor in it, and it holds the mixture fixed. The model shows falling off the pipe as a sharp step, sharper than a real dyno, and where the step lands can depend on the direction of the sweep. Nothing here says how an engine will ride. Use WaveDyno to compare designs and to understand what the intake and the pipe are doing. See the Terms of Service, section 4.