Raise the exhaust port: what 2 mm does, and what the pipe does about it
Tutorial 4 · about 25 minutes plus five sweeps
Raising the exhaust roof is a common porting change. Everyone knows the direction: more top end, less bottom end, and the pipe may need to follow. What's hard to know in advance is how much each millimetre moves, where the curve crosses over, and whether a pipe retuned for the new timing gets the bottom back or pushes the top further.
In this guide you take the 125 cc motocross engine from Your first expansion-chamber sim, sweep it, then raise the exhaust 1 mm and 2 mm and read what moved. Then you retune the pipe for the higher port in both directions: a longer header that times the pipe back where it was, and a shorter one that pushes it up with the port. Each run changes one thing.
The method is the one from Compare two pipes and Tune a 50 cc moped pipe. Tutorial 2 explains the comparison tools in more detail and shows what falling off the pipe looks like in WaveDyno; you'll see it again here.
Everything here runs on WaveDyno's free plan with daily run limits. Each sweep in this guide has 19 points and counts against the daily limit. The Run dyno button shows the estimate before you start.
The engine
The same engine as tutorial 1: the 125 moto-X / enduro template with all its defaults.
| Bore × stroke | 54 × 54.5 mm |
|---|---|
| Exhaust | a main window (38 mm chord) and a booster pair (18 mm each), 188° duration |
| Transfers | 128° duration (entries A, B and C in the Port windows card) |
| Pipe | expansion chamber, 843 mm, tuned ≈ 12900 rpm |
It isn't anyone's actual engine. If you have your own, enter your own numbers. Your results will differ from these, and that's the point.
1. Build the engine and set the sweep
Open the Setup wizard (on a new account it opens by itself; otherwise click the + next to the project name). Choose 125 moto-X / enduro, leave every answer at its default, name the project and click Create project.
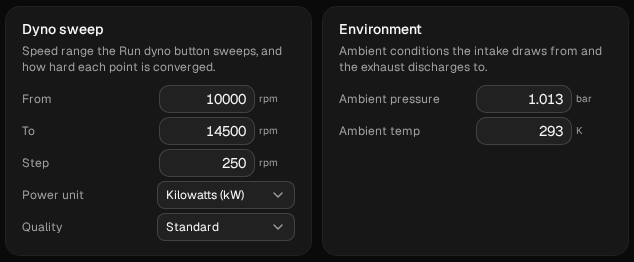
Open Run → Setup and change the sweep to:
| Field | Value |
|---|---|
| From | 10000 |
| To | 14500 |
| Step | 250 |
| Quality | Standard |
That's 19 points. The wizard suggests 8,000–14,000 rpm in 500 rpm steps. A higher port is meant to move the power up, so the sweep starts higher and ends higher, and the finer step shows where the engine falls off the pipe to within 250 rpm. Leave the other fields as they are.
Keep these four values for every run in this guide. Compare will overlay runs on different rpm points, but its tooltip only shows a delta where the baseline run has exactly the same rpm, so keep the grid identical and every sampled point gets one. Keep the sweep going upwards, too: where the engine falls off the pipe can depend on the direction of the sweep (Compare two pipes, step 5).
2. Run the baseline
Click Run dyno. When the sweep is done, open Compare in the Dyno chart header and name the run baseline. Check that no point is drawn as a hollow circle with a red outline: a flagged point isn't a result. (In our five runs, all 95 points converged.)
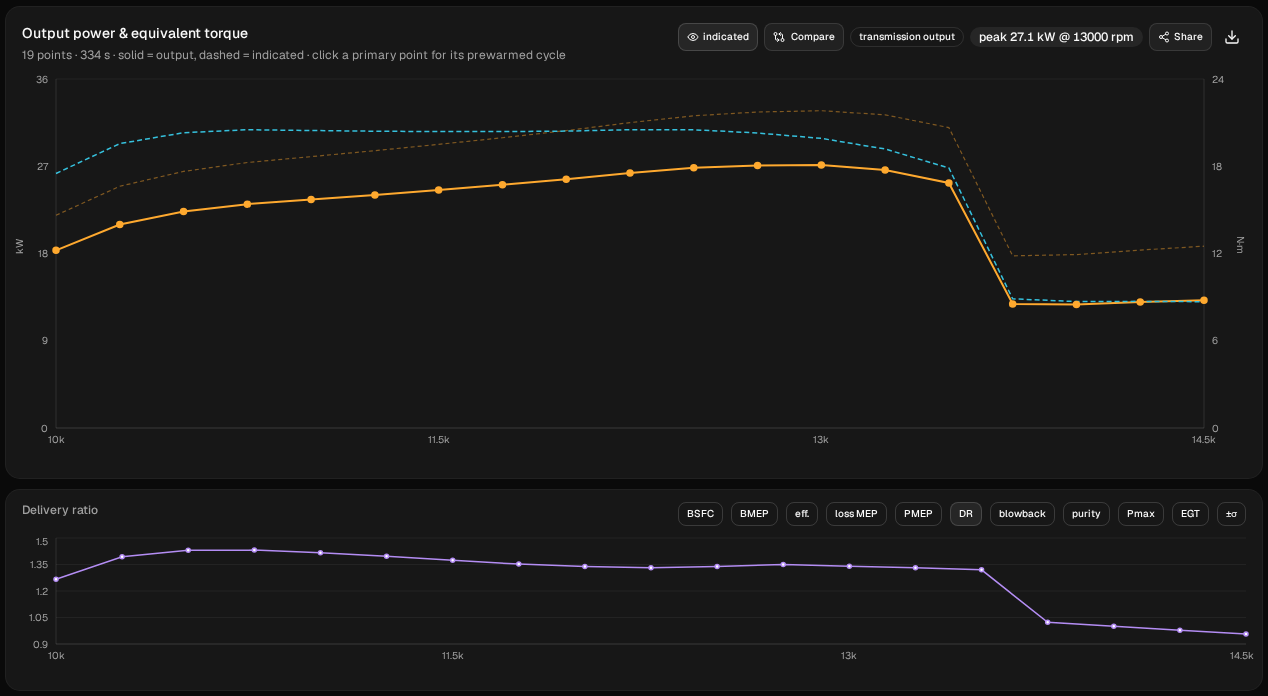
The baseline climbs from 18.33 kW at 10,000 rpm to its highest sampled point, 27.13 kW (36.4 hp) at 13,000 rpm, holds within 0.5 kW of that to 13,250, then falls off the pipe: 25.22 kW at 13,500, 12.79 kW at 13,750. Above that it stays at about 13 kW.
That fall-off is a step between two points, sharper than a real dyno would show it. Read it as “the engine falls off the pipe somewhere between 13,500 and 13,750 rpm” and don't read anything into the kW just past the edge. Four of the five runs in this guide fall off inside the sweep, and where they do is one of the things the port and the pipe move. The fifth is still on the pipe at the last point, 14,500 rpm.
3. Read the port you have
Open Build → Ports. Three cards matter.
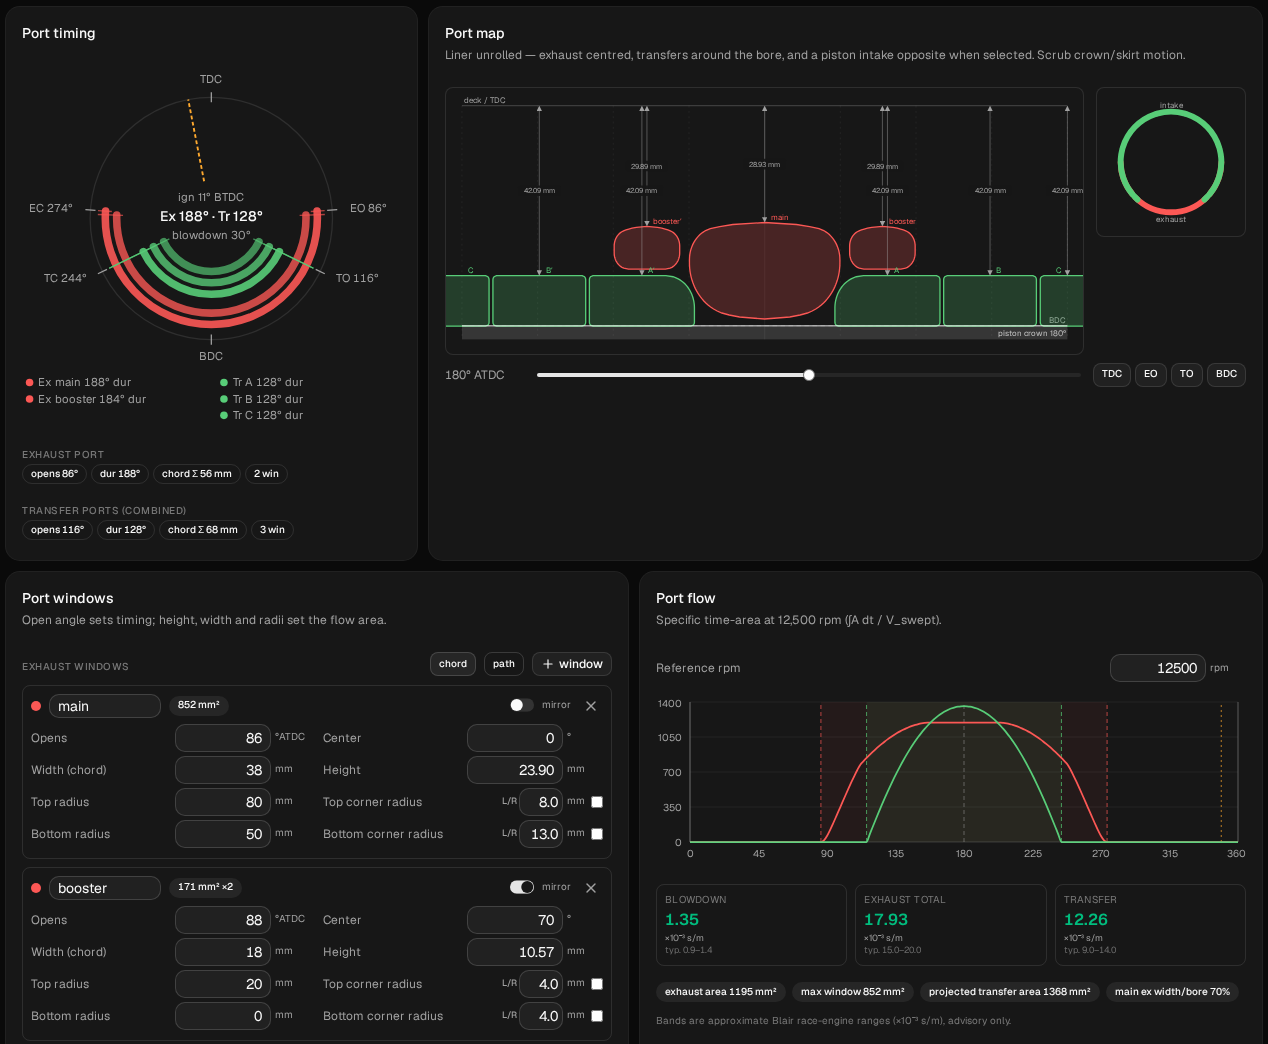
Port timing. The ring reads Ex 188° · Tr 128°, EO 86°, EC 274°, blowdown 30°.
Port windows. Under Exhaust windows there are two entries: main, Opens 86 °ATDC, Height 23.90 mm, and booster (a mirrored pair), Opens 88, Height 10.57. The ring's Ex figure is the duration of the earliest-opening window, here the main.
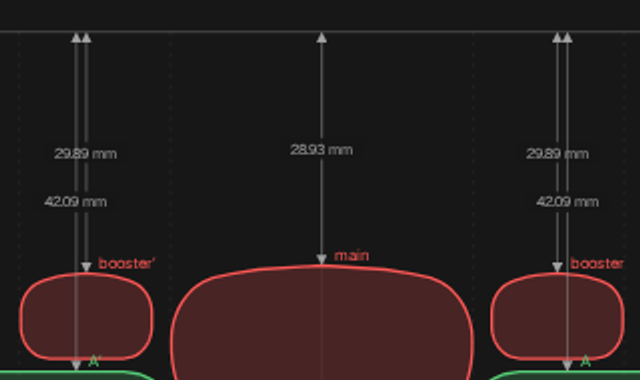
Port map. The liner unrolled, with a dimension from the deck to the roof of each window: 28.93 mm for the main and 29.89 mm for each booster. The labels are small; zoom the browser in to read them.
Ports takes degrees, not millimetres
A porter thinks in millimetres from the deck. Build → Ports takes the opening angle. You type Opens, and the Port map shows you the deck-to-roof depth that angle gives. Changing Opens moves the roof and keeps the floor where it is, the way a file does, so Height follows by itself.
For this engine, raising both roofs by 1 mm and 2 mm means:
| Raise | main Opens | booster Opens | main depth | booster depth | Ex duration |
|---|---|---|---|---|---|
| none | 86 | 88 | 28.93 mm | 29.89 mm | 188° |
| 1 mm | 83.9 | 85.9 | 27.91 mm | 28.88 mm | 192.2° |
| 2 mm | 81.9 | 83.9 | 26.94 mm | 27.91 mm | 196.2° |
That table is for this engine only. How many degrees a millimetre is worth depends on the stroke, the rod length and how far down the bore the roof sits, so it's different on your engine. Here the first millimetre was 2.1° and the second 2.0°. On your own engine, move Opens in 0.1° steps until the Port map shows the depth you want.
Both roofs go up by the same amount. When you raise the main you raise the auxiliary ports with it, so they don't lag behind; raising the main alone would be a different change.
Why not the wizard? Its Enter timing as option takes a depth from the deck in mm, but any exhaust timing other than the template's makes the wizard rebuild the pipe for the new port, so the port and the pipe would change together.
Two more things to note
Port flow. This card gives Blair's specific time-area at a reference rpm (12,500 here) against his typical bands for a race engine. At baseline, Blowdown reads 1.35 (typ. 0.9–1.4) and Exhaust total 17.93 (typ. 15.0–20.0), in ×10⁻³ s/m, both green. The app marks the bands advisory only.
The tuned ≈ badge. Open Build → Ducts. The badges read 843 mm total and tuned ≈ 12900 rpm, header 265.0 mm. The badge assumes the pulse leaves the port when the exhaust opens and the baffle's reflection should come back around the time the transfers close. Open the exhaust earlier and the pulse has more crank angle for the round trip, so the same pipe reads a higher tuned rpm. Watch it move in the next step without anyone touching the pipe.
4. Raise it 1 mm
On Build → Ports, in the main window card, change Opens from 86 to 83.9. In the booster card, change it from 88 to 85.9. Type the values exactly. Leave everything else alone.
Check before you run:
- Port map: 27.91 mm (main) and 28.88 mm (booster), the roofs 1 mm higher.
- Heights: 24.92 and 11.58 mm; the floors didn't move.
- Ring: Ex 192.2°, blowdown 32.1°.
- Build → Ducts: still 843 mm total and header 265.0, but tuned ≈ 13100 rpm.
The Port flow card has moved too: Blowdown 1.59, now above its typical band and drawn in blue, Exhaust total 19.50. It's advisory, not a warning, and the app shows no warning for either edit. Keep it in mind when you read the result.
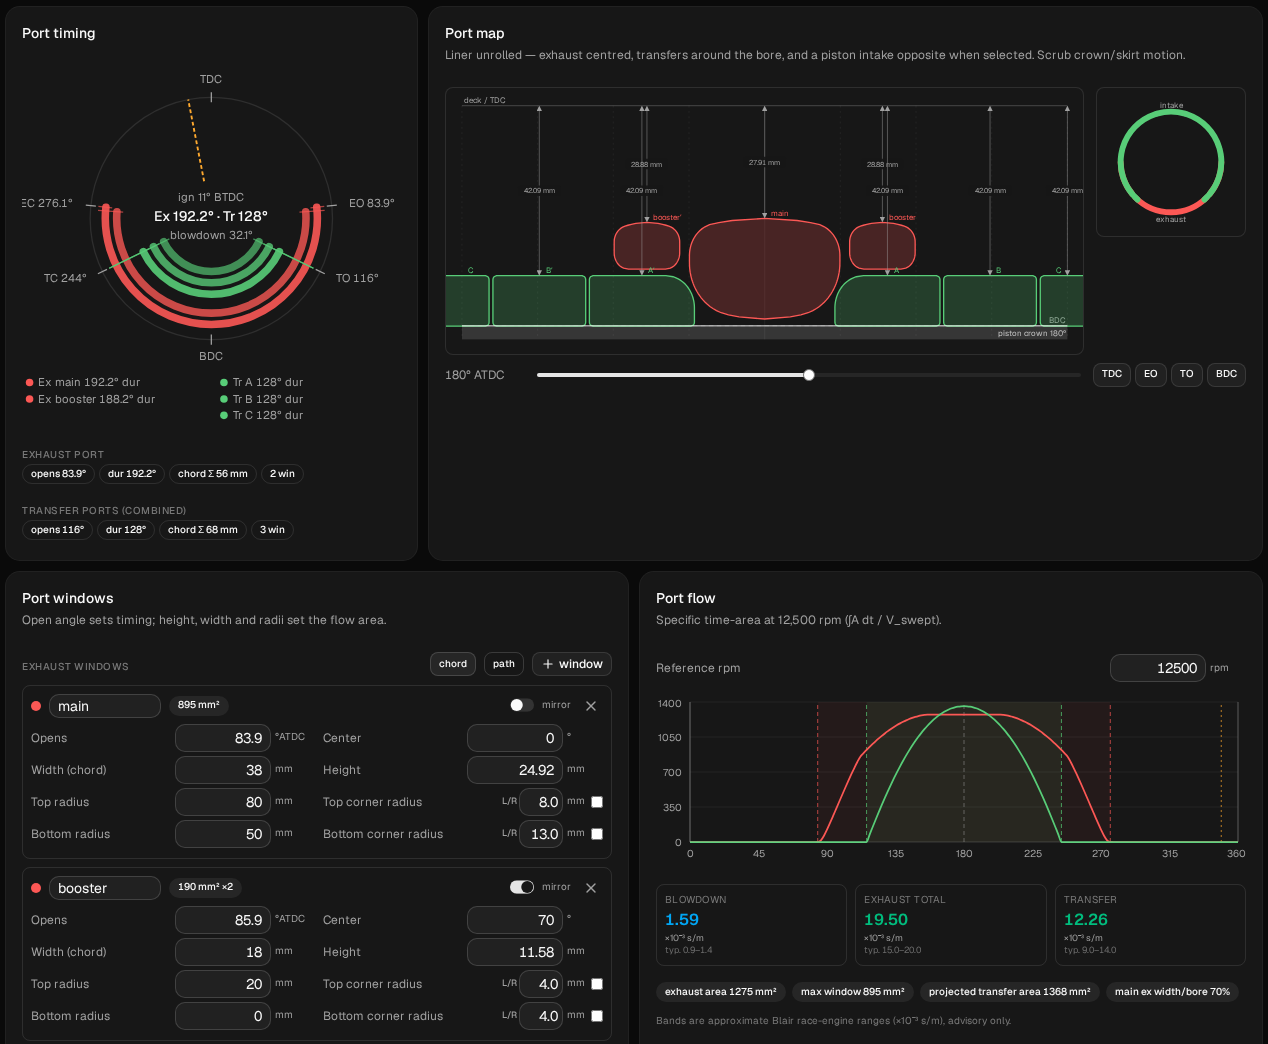
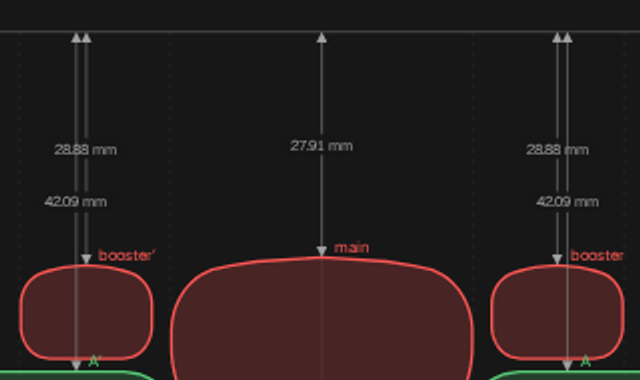
Run the sweep and name it port +1. In Compare, click baseline on the baseline run so the tooltip shows deltas.
Here's what moved:
- It costs below 12,500 rpm. Every point from 10,000 to 12,250 is down: by 1.60 kW (8.7 %) at 10,000, 1.10 kW at 11,000, 0.42 kW at 12,000 and 0.25 kW at 12,250.
- It pays from 12,500 up. The curves cross between 12,250 and 12,500. From there to 13,500,
port +1is ahead by 0.05 to 2.50 kW, and the gap grows with rpm. - It stays on the pipe 500 rpm longer. At 14,000 it still makes 26.76 kW where the baseline has dropped to 12.73. It falls off between 14,000 and 14,250.
- The highest sampled point moves up 250 rpm: 27.87 kW (37.4 hp) at 13,250, against 27.13 kW (36.4 hp) at 13,000. That's 0.74 kW more.
So 1 mm did what the textbook says, and the sweep puts sizes on it: 1.6 kW lost at the bottom of this sweep, up to 2.5 kW gained near the top, two more steps on the pipe.
5. Raise it 2 mm
Put the port back first. Open Compare, click the restore icon on baseline and confirm Restore settings. Check that the window cards read 86 and 88 again and the Port map 28.93 / 29.89 mm. The run selector at the top still shows the last run's name after a restore. That's expected; the settings are the baseline's.
Now set Opens to 81.9 (main) and 83.9 (booster). Check:
- Port map: 26.94 mm and 27.91 mm, 2 mm up from baseline.
- Heights: 25.89 and 12.55 mm.
- Ring: Ex 196.2°, blowdown 34.1°.
- Build → Ducts: 843 mm total, tuned ≈ 13200 rpm.
- Port flow: Blowdown 1.83 and Exhaust total 21.04, both now above their typical bands. The exhaust area chip under the card reads 1351 mm², up from 1195 at baseline.
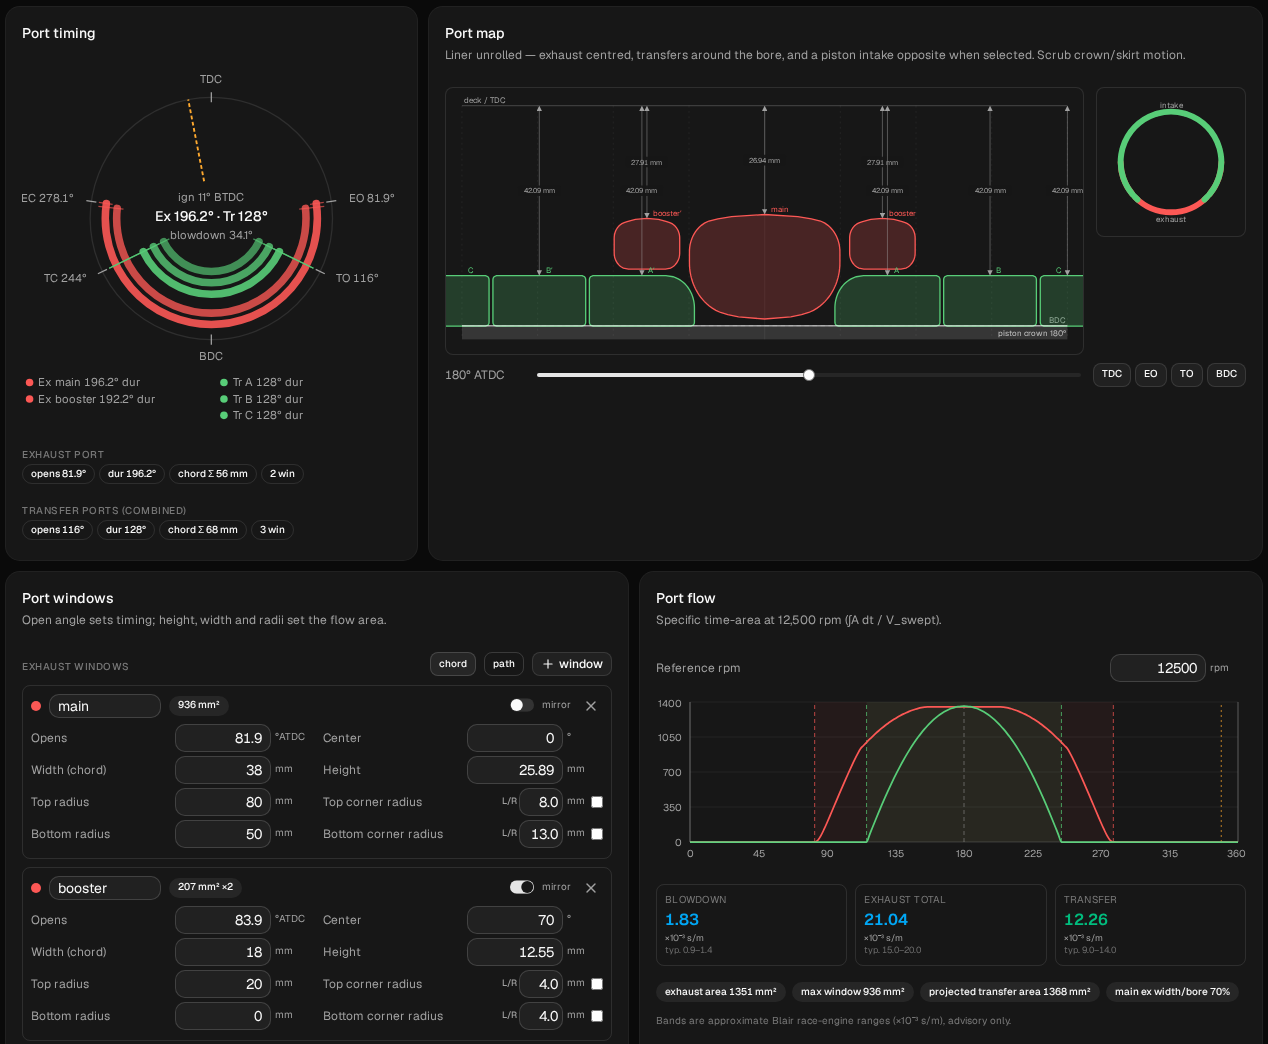
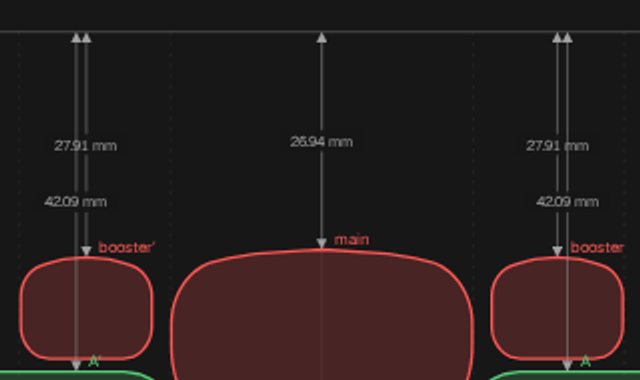
Run the sweep, name it port +2, and set baseline as the baseline in Compare.
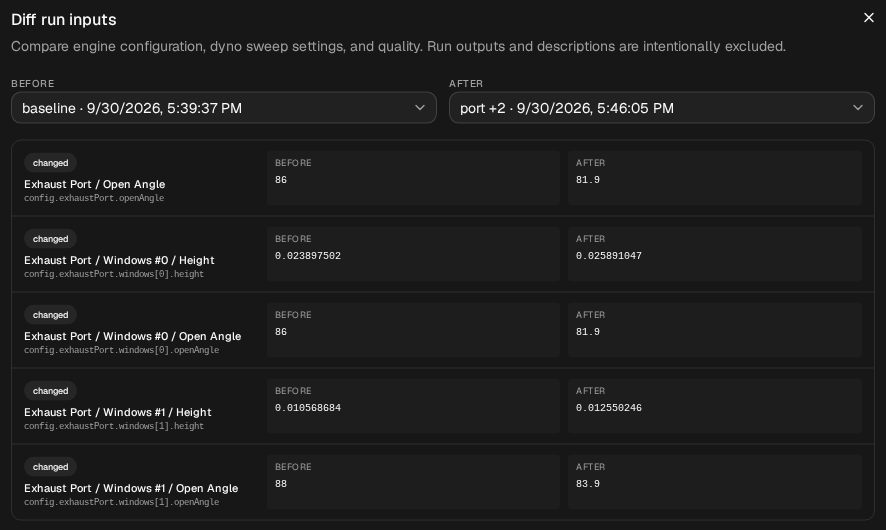
Check that only the port changed. The run description (the icon next to the run selector) lists Changes from previous run, and the previous run was port +1, so it shows 83.9 → 81.9, not the change from baseline. Use Compare → Diff inputs against baseline instead. It should show five changes: the open angle of each window, the height of each window (in metres: that's the roof moving and the floor staying), and the exhaust port's own openAngle, which is the earliest window's and follows the main. Nothing in the pipe, nothing in the ignition.
Compare shows four runs at a time by default; Compare → Visible runs goes from 2 to 8. Tick baseline, port +1 and port +2.
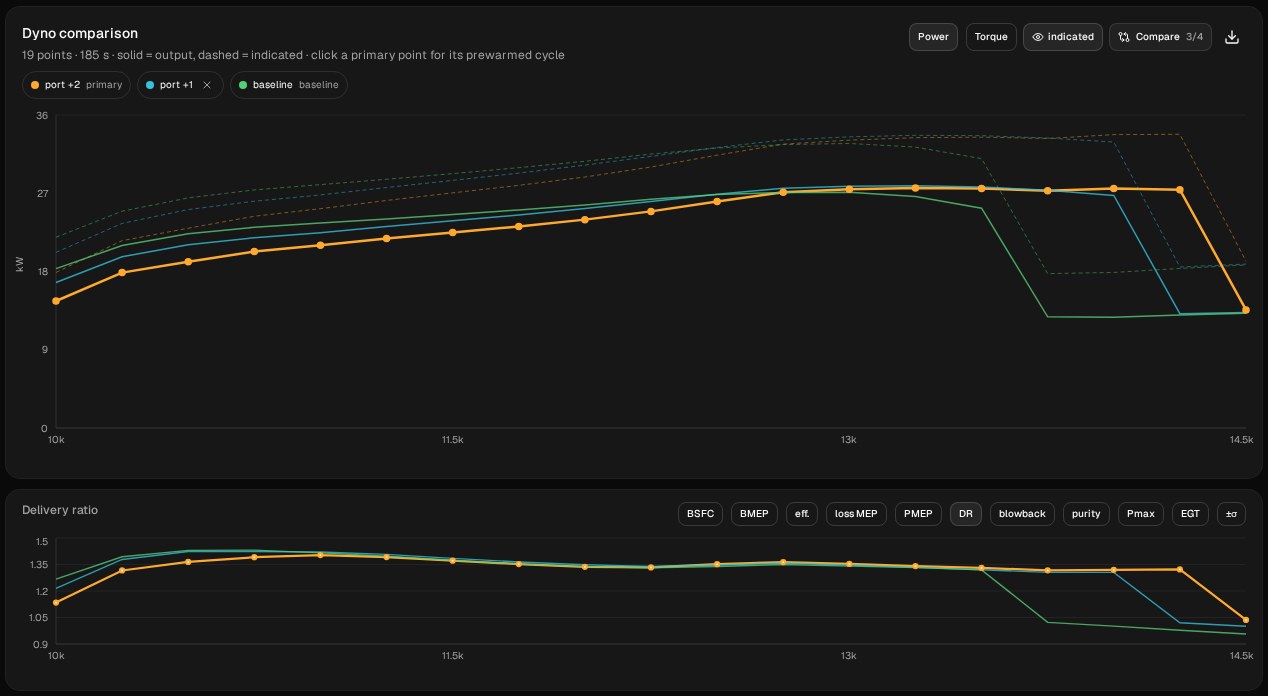
All three, point by point:
| rpm | baseline kW | port +1 kW | port +2 kW | +2 vs baseline kW |
|---|---|---|---|---|
| 10,000 | 18.33 | 16.73 | 14.61 | −3.72 |
| 10,250 | 20.99 | 19.71 | 17.87 | −3.12 |
| 10,500 | 22.33 | 21.09 | 19.11 | −3.22 |
| 10,750 | 23.09 | 21.89 | 20.29 | −2.80 |
| 11,000 | 23.57 | 22.46 | 21.00 | −2.56 |
| 11,250 | 24.04 | 23.17 | 21.79 | −2.26 |
| 11,500 | 24.55 | 23.83 | 22.49 | −2.06 |
| 11,750 | 25.08 | 24.50 | 23.18 | −1.90 |
| 12,000 | 25.66 | 25.24 | 23.96 | −1.70 |
| 12,250 | 26.31 | 26.06 | 24.92 | −1.40 |
| 12,500 | 26.85 | 26.90 | 26.05 | −0.79 |
| 12,750 | 27.09 | 27.56 | 27.12 | +0.04 |
| 13,000 | 27.13 | 27.80 | 27.46 | +0.33 |
| 13,250 | 26.68 | 27.87 | 27.62 | +0.94 |
| 13,500 | 25.22 | 27.72 | 27.55 | +2.33 |
| 13,750 | 12.79 | 27.35 | 27.27 | off the pipe vs on |
| 14,000 | 12.73 | 26.76 | 27.52 | off the pipe vs on |
| 14,250 | 12.97 | 13.15 | 27.39 | off the pipe vs on |
| 14,500 | 13.16 | 13.29 | 13.58 | all off the pipe |
Figures in italics are off the pipe.
Read it in three parts.
What 2 mm cost. Every point from 10,000 to 12,500 rpm is down, by 3.72 kW (20 %) at 10,000, 2.56 kW at 11,000 and 1.70 kW at 12,000. The curves don't meet until 12,750, where the two runs are equal to within 0.036 kW. That's 250 rpm later than the 1 mm crossover.
What it bought. It's ahead from 13,000 to 13,500, by 0.33 to 2.33 kW, and it stays on the pipe to 14,250: three steps beyond the baseline, one beyond port +1. Its highest sampled point is 27.62 kW (37.0 hp) at 13,250 rpm, 0.49 kW above the baseline's best. It stays on the pipe for four more points and falls off between 14,250 and 14,500.
Was the second millimetre worth the first? No, and that's the most useful thing in this table. Below 12,500 rpm the 2 mm loss is 2.3 to 5.5 times the 1 mm loss, not twice. The second millimetre on its own (port +2 against port +1) costs 0.8 to 2.1 kW at every point from 10,000 to 12,500, and it is also behind port +1 from 12,750 to 13,750 by 0.08 to 0.43 kW. Its highest sampled point is 0.26 kW below port +1's. What it adds is one more step on the pipe, at 14,250.
Switch the second chart under the power curve to EGT, then to DR.
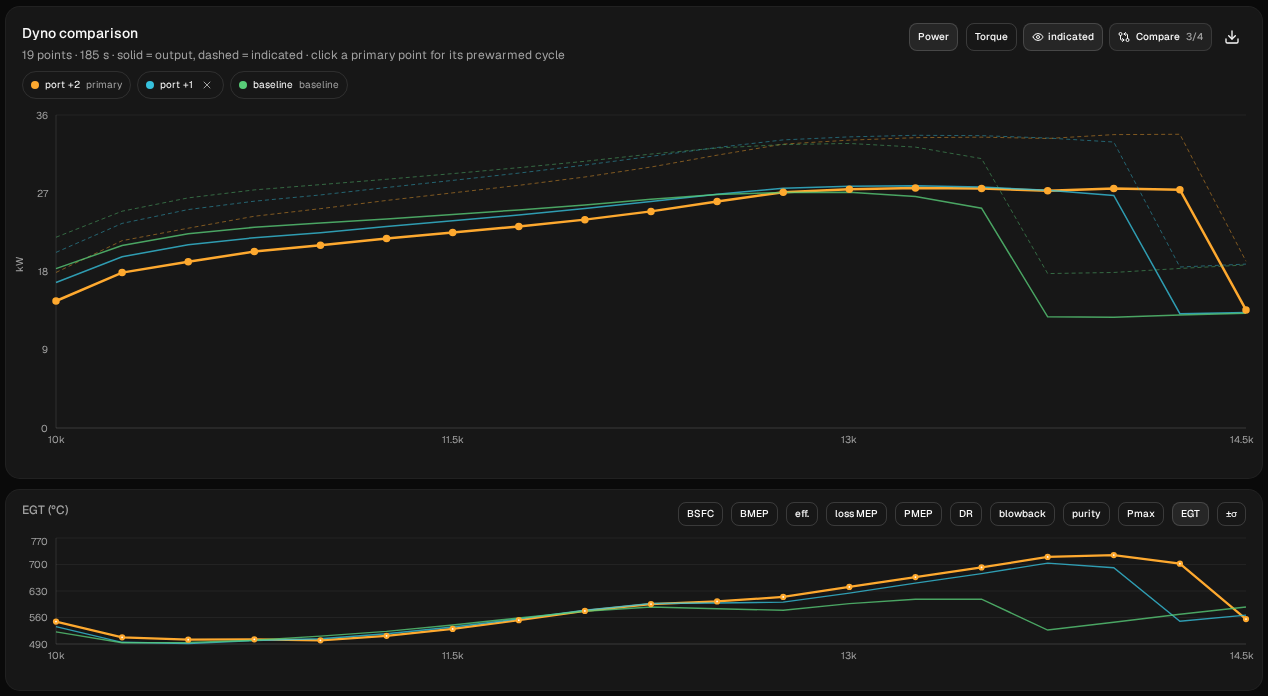
- EGT: both raised ports run hotter than the baseline at every point from 12,000 to 14,000 rpm. At 13,750 the baseline reads 527 °C, off the pipe, and
port +2720 °C.port +2peaks at 726 °C at 14,000. It's also hotter at the bottom of the sweep: 549 °C against 522 °C at 10,000. - DR (delivery ratio, the fresh charge that comes in per cycle compared with what the swept volume holds at ambient density) follows the power. At 10,000 rpm
port +2delivers 1.13 against the baseline's 1.27. From 12,500 rpm up it's slightly higher at every point where both are on the pipe: 1.33 to 1.36 against the baseline's 1.32 to 1.35. DR counts the charge coming in, not how much of it stays, so read it as the direction of the change, not the whole explanation.
On this model, then, a higher port behaves the way porters describe it: it trades the bottom for the top. What the sweep adds is how steep the trade is. The first millimetre cost a little and bought a clear gain at the top. The second cost more than the first and bought less. A power valve makes the same trade the other way round, lowering the roof at low rpm: What does a power valve actually do? runs this engine with both roofs 2 mm lower.
6. Retune the pipe: time it back where it was
The port moved the tuned ≈ badge from 12,900 to 13,200 rpm without the pipe changing. The first retune puts it back: lengthen the header until the badge reads 12,900 again, so the pipe is timed for the old rpm with the new port. The header is the cleanest single change to a pipe's length (Compare two pipes).
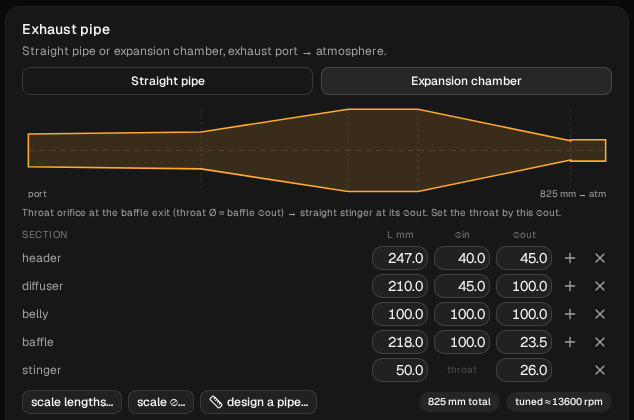
Don't restore anything: the project is at port +2. On Build → Ducts, change the header's L mm from 265.0 to 283.0. Type it in the table; don't use scale lengths…. The badges now read 861 mm total and tuned ≈ 12900 rpm.
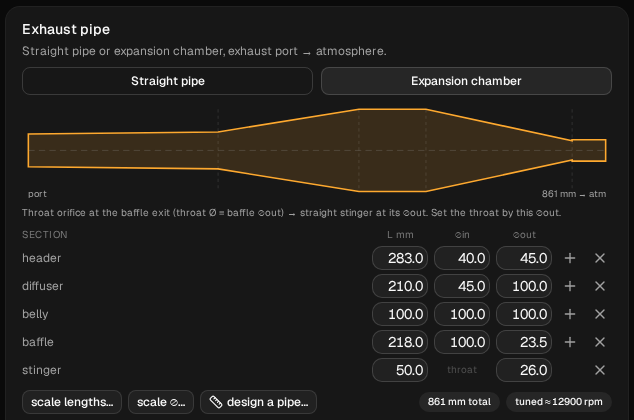
Run it and name it port +2 header 283. In Diff inputs against port +2 you should see the header length (0.265 → 0.283, in metres) and Num Elements going from 99 to 101. That's the solver dividing the longer pipe into more cells, not a setting.
Then restore port +2, check that the header reads 265.0 and the badge 13200 again, change the header to 247.0 mm and check 825 mm total and tuned ≈ 13600 rpm. Run it and name it port +2 header 247. That's step 7; run it now so the two retunes can be compared together. Diff inputs against port +2 shows the header and Num Elements 99 → 96.
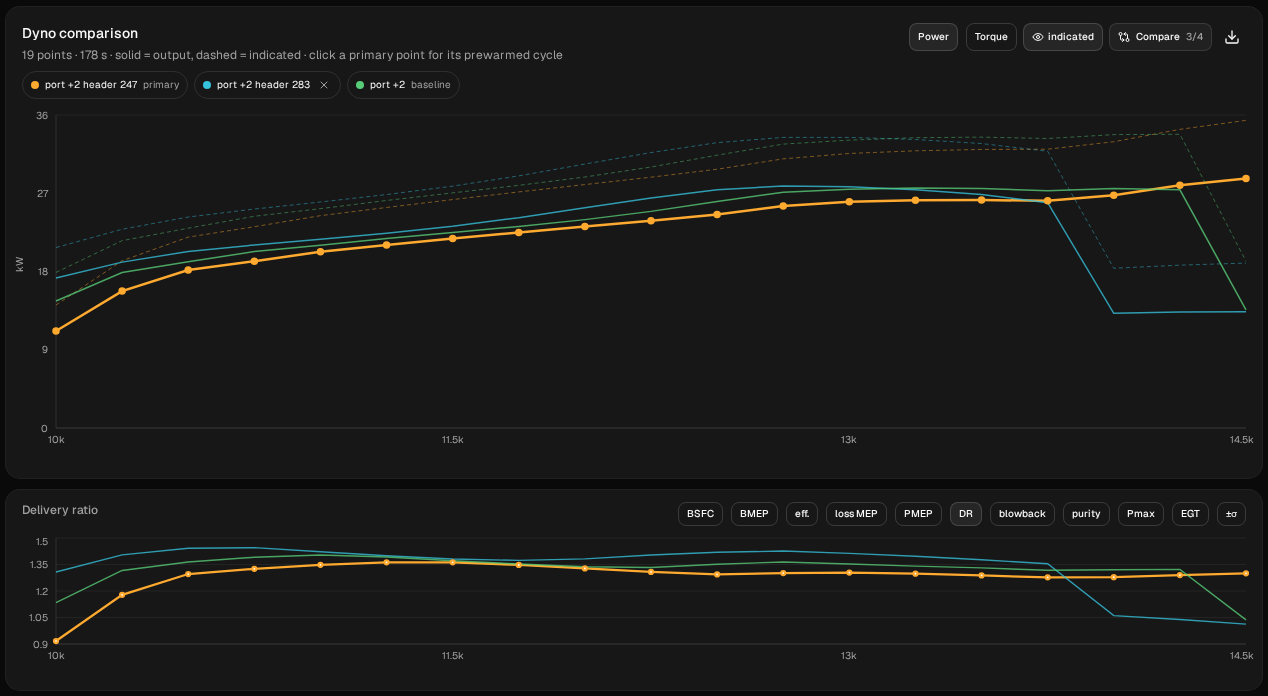
In Compare, tick port +2, port +2 header 283 and port +2 header 247, and set port +2 as the baseline.
| rpm | baseline kW | port +2 kW | header 283 kW | header 247 kW |
|---|---|---|---|---|
| 10,000 | 18.33 | 14.61 | 17.24 | 11.16 |
| 10,250 | 20.99 | 17.87 | 19.08 | 15.75 |
| 10,500 | 22.33 | 19.11 | 20.29 | 18.17 |
| 10,750 | 23.09 | 20.29 | 21.05 | 19.17 |
| 11,000 | 23.57 | 21.00 | 21.71 | 20.27 |
| 11,250 | 24.04 | 21.79 | 22.41 | 21.03 |
| 11,500 | 24.55 | 22.49 | 23.21 | 21.77 |
| 11,750 | 25.08 | 23.18 | 24.19 | 22.50 |
| 12,000 | 25.66 | 23.96 | 25.34 | 23.16 |
| 12,250 | 26.31 | 24.92 | 26.45 | 23.83 |
| 12,500 | 26.85 | 26.05 | 27.40 | 24.58 |
| 12,750 | 27.09 | 27.12 | 27.84 | 25.52 |
| 13,000 | 27.13 | 27.46 | 27.74 | 26.00 |
| 13,250 | 26.68 | 27.62 | 27.41 | 26.19 |
| 13,500 | 25.22 | 27.55 | 26.87 | 26.23 |
| 13,750 | 12.79 | 27.27 | 25.91 | 26.10 |
| 14,000 | 12.73 | 27.52 | 13.20 | 26.78 |
| 14,250 | 12.97 | 27.39 | 13.35 | 27.92 |
| 14,500 | 13.16 | 13.58 | 13.38 | 28.69 |
Figures in italics are off the pipe.
Take the longer header first, against port +2:
- It gives back some of the bottom. It's ahead at every point from 10,000 to 13,000 rpm: by 2.63 kW at 10,000, 0.28 to 1.53 kW from 10,250 to 13,000. Above that it's behind.
- It gives back most of the extra top. It falls off between 13,750 and 14,000 rpm, one step after the baseline, and loses the two points
port +2held on the pipe. - Its highest sampled point is 27.84 kW (37.3 hp) at 12,750 rpm, 0.03 kW under port +1's best.
And against the baseline, where you started:
- From 10,000 to 12,000 rpm it's still down, by 0.31 to 2.03 kW, and about level at 12,250. Timing the pipe back recovered part of what the port cost there, not all of it. How much depends on the rpm: at 10,000 it recovered 2.63 of the 3.72 kW, at 11,000 only 0.71 of 2.56.
- From 12,250 to 13,500 it's ahead, by 0.14 to 1.65 kW, and its best point is 0.71 kW above the baseline's, 250 rpm lower.
- It falls off one step later, between 13,750 and 14,000.
- It runs cooler than
port +2at the top: 646 °C against 720 °C at 13,750. And its DR is the highest of the five runs at every point from 11,750 to 13,750 rpm, with its own highest value, 1.45, at 10,750.
So a higher port with the pipe timed back gives a different trade from the port alone: a little less at the bottom than stock, a little more through the top of the band, and one step of extra over-rev instead of three.
7. Or push the pipe up with the port
The shorter header, against port +2:
- It costs almost everywhere the engine is on the pipe in both runs. From 10,000 to 14,000 rpm it's behind by 0.68 to 3.45 kW. At 14,250 it's 0.53 kW ahead.
- It's still on the pipe at 14,500, where
port +2has fallen off: 28.69 kW (38.5 hp), the highest figure in this guide.
Read that last number with care. It's the last point of the sweep, and the curve is still rising into it (26.78, 27.92, 28.69 kW over the last three points). This sweep can't tell you where this pipe peaks or where it falls off. Against the baseline, the shorter header is down at every point from 10,000 to 13,250 rpm, by 7.17 kW (39 %) at 10,000 and still 0.49 kW at 13,250. At 13,500 it's 1.01 kW ahead, and above that the baseline is off the pipe. It also runs the hottest: 747 to 755 °C from 14,000 to 14,500.
To find out what it does above 14,500, you'd need a sweep that goes higher, and a new baseline on the same points to compare it with.
The five runs side by side
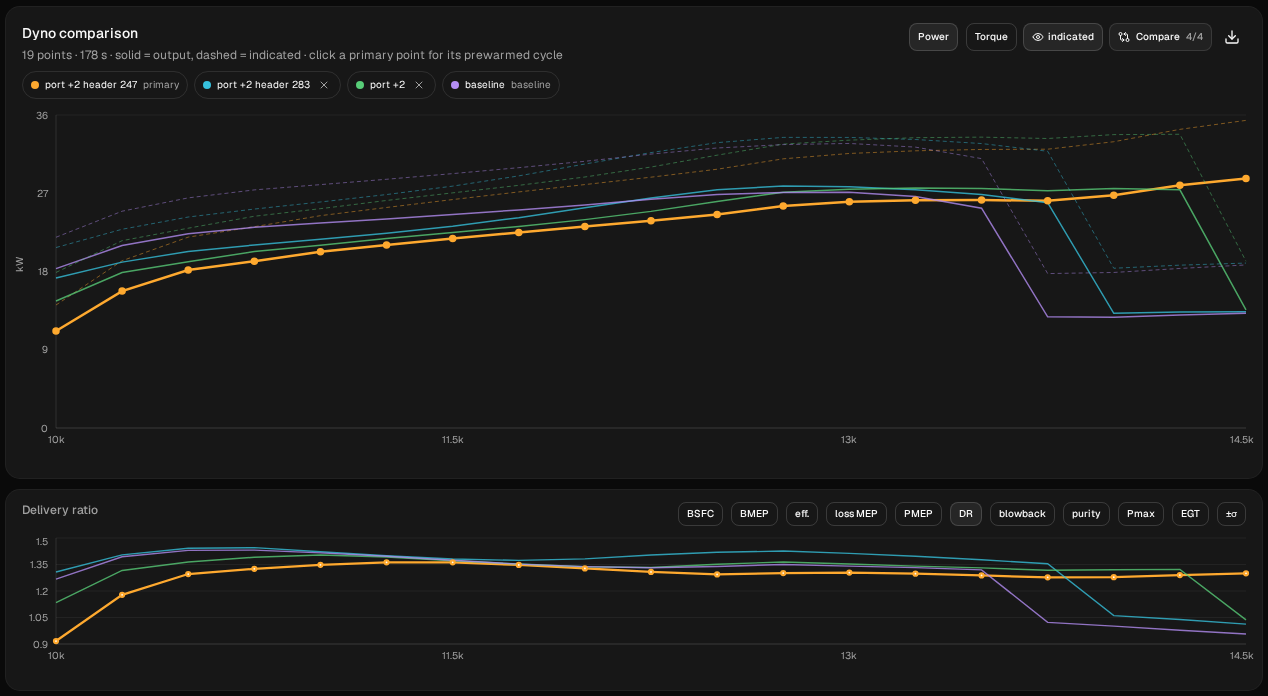
This chart uses Compare's default of four visible runs and leaves port +1 out; its curve is in the step 5 chart. To overlay all five, set Compare → Visible runs to 5. Here's the summary. The peak chip only shows when one run is visible, so read each run's peak on its own.
| Run | Ex duration | tuned ≈ | Highest sampled point | Falls off the pipe between |
|---|---|---|---|---|
baseline | 188° | 12,900 | 27.13 kW (36.4 hp) at 13,000 | 13,500 and 13,750 |
port +1 | 192.2° | 13,100 | 27.87 kW (37.4 hp) at 13,250 | 14,000 and 14,250 |
port +2 | 196.2° | 13,200 | 27.62 kW (37.0 hp) at 13,250 | 14,250 and 14,500 |
port +2 header 283 | 196.2° | 12,900 | 27.84 kW (37.3 hp) at 12,750 | 13,750 and 14,000 |
port +2 header 247 | 196.2° | 13,600 | 28.69 kW (38.5 hp) at 14,500, the last point | not within the sweep |
In the four runs that fall off inside the sweep, the rpm where the engine falls off the pipe moved the same way as the tuned ≈ badge, but the two with a badge of 12,900 fall off one step apart. The fifth, port +2 header 247, didn't fall off inside the sweep: it's still on the pipe at 14,500, which fits its higher badge but doesn't place its fall-off. That's worth knowing about the badge on this engine. It still doesn't tell you where the power peaks: the highest sampled points sit anywhere from 150 rpm below the badge to 900 rpm above it.
What to take from it
On this model, with this pipe:
- 1 mm up (192.2°) cost up to 1.60 kW below 12,500 rpm, gained up to 2.50 kW from 12,500 to 13,500, and kept the engine on the pipe 500 rpm longer.
- 2 mm up (196.2°) cost up to 3.72 kW below 12,750 rpm, more than twice what 1 mm cost, and was behind
port +1from 12,750 to 13,750. It bought one more step on the pipe, and its best sampled point is 0.26 kW below port +1's. - Timing the pipe back (header +18 mm) recovered part of the bottom, not all of it, and brought the fall-off back to one step above stock, for a best point 0.71 kW above stock.
- Pushing the pipe up (header −18 mm) cost at every point below 13,500 and kept the engine on the pipe to at least 14,500. The highest sampled point is at 14,500; this sweep does not locate its peak or fall-off.
Those are answers for one engine that you can check, not rules. And you now have a way of getting them for yours:
- Enter your own engine and your own port. Set each window's Opens until the Port map shows the depth you're planning to cut. Don't use this guide's degrees-per-millimetre on a different engine.
- Go in small steps. Here the second millimetre didn't behave like the first. Run each step as its own sweep before deciding on the next.
- Change one thing at a time. Restore the baseline before each change, keep From, To and Step the same, and check with Diff inputs against the run you're comparing with, not the run description.
- Retune the pipe as a separate run. The port and the pipe move the curve in different places. If you change both at once, you can't tell which did what.
- Check it on a real dyno. If you have dyno sheets from before and after a port job on the same engine and pipe, join the tester programme. That comparison is what we most want to see.
These are simulated estimates from a 1D gas-dynamics model of a generic engine, not measurements, and not your engine. The model isn't calibrated against a dyno. Even the differences between the runs hold only for this model. It shows falling off the pipe as a sharp step, sharper than a real dyno, and where the step lands can depend on the direction of the sweep. Use WaveDyno to compare designs and to understand what the port and the pipe are doing, and confirm on a real dyno before cutting metal you can't replace. See the Terms of Service, section 4.