Crankcase compression on a two-stroke: what 1.35 and 1.60 do to the powerband
Tutorial 8 · about 10 minutes plus three sweeps
A two-stroke's crankcase is its pump. As the piston comes down it compresses the mixture under it, and when the transfers open, that pressure pushes the mixture up into the cylinder. How hard it pushes depends on how much the case volume shrinks: the crankcase compression ratio, also called primary compression. Make the case smaller, with stuffers in the crank wheels or a filled case, and the ratio goes up.
The usual rule is that more case compression pumps harder low down and less favours the top end. WaveDyno's own help text for the field says the same: “higher pumps harder at low rpm, lower favours top end”. This guide tests that on one engine. You build the app's 100 cc kart engine, sweep it, then lower its case compression and sweep again, then raise it and sweep a third time. Each run changes one number.
What the page can't answer:
- Your engine. The example is the app's kart archetype: a 100 cc air-cooled single with a reed intake. It isn't a KT100, an X30, a KA100 or anyone's actual engine. It shows what changes when only the case compression changes.
- A real stuffer or a filled case. In the app, case compression is one number. It sets how big the case is, and nothing else. Stuffing a real crank also changes the flow paths in the case, the space around the transfer entries and how the intake behaves. None of that is in these runs.
- A real reed. The kart engine's reed is the app's ideal valve: it opens and closes instantly with the pressure and lets nothing flow back out. Tutorial 7 explains what that means for the results.
Everything here runs on WaveDyno's free plan with daily run limits. Each sweep has 33 points and counts against the daily limit; the Run dyno button shows the estimate before you start (5.3 units for each sweep here). A finished sweep is charged what it actually used, up to its estimate. Three sweeps fit in one UTC day, unless you've already used most of today's. Your runs stay in the project.
What the number means
The app defines case compression as the case volume with the piston at the top, divided by the volume with the piston at the bottom. The difference between the two is the engine's swept volume, so the number fixes how much case is left with the piston at the bottom. On this engine (99.8 cc):
| Case compression | Case volume, piston at the bottom | Piston at the top |
|---|---|---|
| 1.35 | 285 cc | 385 cc |
| 1.48 (the kart engine as built) | 208 cc | 308 cc |
| 1.60 | 166 cc | 266 cc |
So going from 1.48 to 1.60 takes about 42 cc out of the case, and going to 1.35 adds about 77 cc. The two values are our choice, a similar step either side of the engine's 1.48. The field's help text calls 1.3–1.5 typical, and the app warns outside 1.15–1.75, so neither run gets a warning.
The Engine tab's field takes the ratio, so if you measure your own case, that's the conversion.
The engine
Build it with the setup wizard (tutorial 1 walks through it): the + button, archetype 100 cc air-cooled kart, keep every answer at its default, and Create.
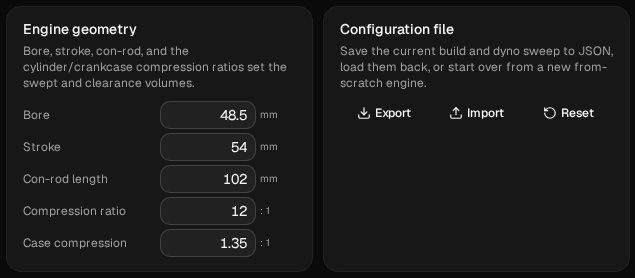
Check what you start from on Build → Engine: Bore 48.5 mm, Stroke 54 mm, Con-rod length 102 mm, Compression ratio 12, Case compression 1.48, and the chips 99.8 cc, 49×54 mm, CR 12.
The wizard sets the dyno to 8,000–18,000 rpm in 500 rpm steps. This engine comes off the pipe just above 18,250, so set Run → Setup to From 12000, To 20000, Step 250, Quality Standard, and leave the rest. That covers the top of the band and the drop in 33 points, and the finer step shows where it falls off. These runs don't go below 12,000, so this page says nothing about lower rpm. Keep the sweep the same for every run: Compare only shows a delta where both runs have the same rpm.
The Engine tab shows a note about mean piston speed. With this sweep it reads “Mean piston speed reaches 36 m/s at 20,000 rpm — beyond road-racing practice; only 100 cc kart-class engines run here.” It's a durability note about the sweep's top end, not a warning, and case compression doesn't change it.
Run it and name it baseline.
In our baseline all 33 points converged. Its best sampled point is 24.34 kW (32.6 hp) at 18,000 rpm, and its highest torque is 15.65 N·m at 13,750. Then it comes off the pipe between 18,250 and 18,500: from 23.83 kW to 9.36, a fall of 60.7 % in one 250 rpm step. Above that it stays off the pipe, at 9.36 kW and below.
A drop that sudden is worth a second look, because the app runs a sweep upwards and starts each point from where the previous one finished. So we ran the same build again from 18,250 up, starting cold: at 18,250 it settled at 9.50 kW, against 23.83 in the full sweep, and the points above agreed within 0.12 kW. The two starts we tried land in different places at 18,250: the rising sweep is still on the pipe there, and the cold start is off it. At 18,250 the two starts returned different results, both marked converged: 23.83 kW from the rising sweep and 9.50 kW from cold. We didn't try a falling sweep. Tutorial 3, step 5, reads a curve like this in detail.
1. Lower it to 1.35
On Build → Engine, change Case compression from 1.48 to 1.35. Nothing else.
Nothing else on the screen changes either: the chips stay the same, there's no case-volume line, and no warning appears.
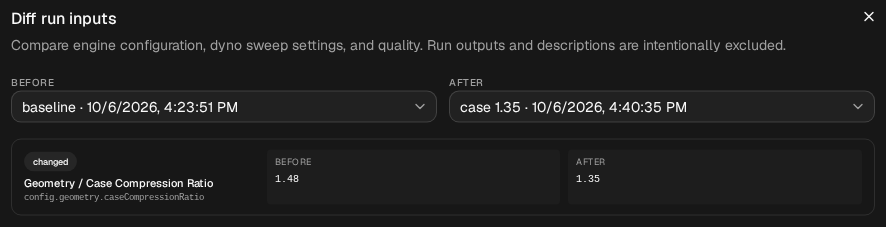
Run it and name it case 1.35. Open Compare → Diff inputs, pick baseline as Before and case 1.35 as After: it should list one change, Geometry / Case Compression Ratio, 1.48 → 1.35. The run's own description lists the changes from the previous run in the project; if you ran something else in between, it shows more. Diff inputs is the one to check.
2. Raise it to 1.60
Change Case compression from 1.35 to 1.60. Nothing else. The field shows 1.6 once you leave it.
Run it and name it case 1.60. Diff inputs with baseline as Before and case 1.60 as After lists one change, 1.48 → 1.6. The run's description says 1.35 → 1.6, because the run before it was case 1.35.
3. Read the three curves
In Compare, show all three runs and click baseline on baseline. Hover a point to read each run's power and its change from the baseline; each run's card also shows its max power and the rpm.
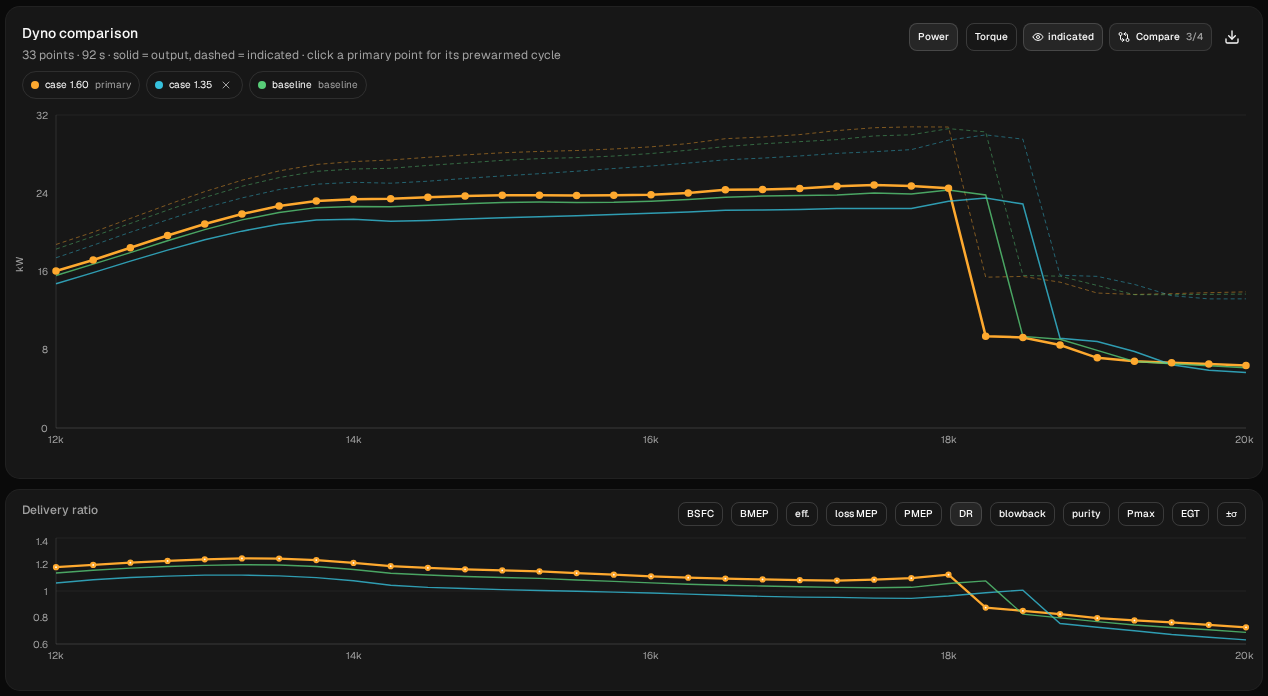
All 33 points of each run converged. Every 500 rpm, and every point around the drop:
| rpm | 1.35 kW | change | 1.48 kW (baseline) | 1.60 kW | change |
|---|---|---|---|---|---|
| 12,000 | 14.75 | −0.85 | 15.60 | 16.06 | +0.46 |
| 12,500 | 17.06 | −0.87 | 17.93 | 18.43 | +0.50 |
| 13,000 | 19.25 | −1.03 | 20.28 | 20.86 | +0.58 |
| 13,500 | 20.84 | −1.19 | 22.03 | 22.69 | +0.66 |
| 14,000 | 21.33 | −1.32 | 22.65 | 23.39 | +0.73 |
| 14,500 | 21.22 | −1.56 | 22.78 | 23.59 | +0.81 |
| 15,000 | 21.50 | −1.55 | 23.05 | 23.80 | +0.75 |
| 15,500 | 21.71 | −1.36 | 23.06 | 23.77 | +0.70 |
| 16,000 | 21.95 | −1.24 | 23.19 | 23.86 | +0.67 |
| 16,500 | 22.26 | −1.32 | 23.58 | 24.37 | +0.79 |
| 17,000 | 22.34 | −1.43 | 23.77 | 24.48 | +0.70 |
| 17,250 | 22.44 | −1.37 | 23.81 | 24.71 | +0.90 |
| 17,500 | 22.44 | −1.57 | 24.02 | 24.84 | +0.82 |
| 17,750 | 22.44 | −1.49 | 23.93 | 24.73 | +0.80 |
| 18,000 | 23.19 | −1.15 | 24.34 | 24.52 | +0.18 |
| 18,250 | 23.51 | −0.33 | 23.83 | 9.39 | −14.44 |
| 18,500 | 22.90 | +13.53 | 9.36 | 9.26 | −0.11 |
| 19,000 | 8.84 | +0.91 | 7.93 | 7.18 | −0.76 |
| 19,500 | 6.47 | −0.09 | 6.56 | 6.67 | +0.11 |
| 20,000 | 5.68 | −0.48 | 6.16 | 6.38 | +0.22 |
Bold: each run's best point. Italics: each run's first point off the pipe (for 1.35 that's 18,750, between the rows shown). The CSV (the download icon in the chart header) has all 33 points.
At 1.60, more power from 12,000 to 17,500, and off the pipe sooner:
- From 12,000 to 17,500 rpm it's ahead at every point, by 0.42 to 0.90 kW (+2.5 to +3.8 %).
- Its best point is 24.84 kW (33.3 hp) at 17,500, 500 rpm lower than the baseline's, and 2.0 % higher. Its highest torque is 16.12 N·m, at 13,750 like the baseline's.
- It comes off the pipe one step sooner, between 18,000 and 18,250. Until then it stays ahead: at 17,750 by 0.80 kW, and at 18,000 by 0.18.
At 1.35, less power from 12,000 to 17,750, and on the pipe longer:
- From 12,000 to 17,750 it's behind at every point, by 0.85 to 1.57 kW (−4.8 to −6.9 %).
- At 18,000 and 18,250, with both still on the pipe, it stays behind: 23.19 kW against the baseline's 24.34 at 18,000, 1.15 kW (4.7 %) behind, and 0.33 kW behind at 18,250. It doesn't get ahead anywhere while the baseline is on the pipe.
- It stays on the pipe one step longer, coming off between 18,500 and 18,750. At 18,500 it still makes 22.90 kW, where the baseline is down to 9.36.
- Its best point is 23.51 kW (31.5 hp) at 18,250, 250 rpm higher than the baseline's, and 3.4 % lower. Its highest torque is 14.76 N·m, at 13,750 like the others.
Off the pipe, from 18,750 up, all three are between 5.68 and 9.17 kW.
So the app's rule holds in half. Higher case compression did pump harder, but not only at low rpm: on this engine it gained a similar share all the way up to the peak. Lower case compression did favour the top end, but mostly in one sense: it held the pipe one 250 rpm step longer, at lower power. While the baseline was still on the pipe, it never made more.
How far did the drop move? One sweep step each way. The sweep can't say more: between one step and the next, the shift could be anything up to 500 rpm. If that's what you need to know, run a finer sweep across the drop, as tutorial 7 did for the rotary disc.
Where the gain comes from: delivery ratio
The second chart under the dyno shows DR, delivery ratio: the mass of mixture that flows in through the intake into the crankcase each cycle, against what would fill the swept volume at ambient air density. It follows the power. At 15,000 rpm, the middle of the band:
| 1.35 | 1.48 | 1.60 | |
|---|---|---|---|
| Delivery ratio | 1.01 | 1.10 | 1.16 |
| Total gas trapped in the cylinder at exhaust closing, mg per cycle | 94.0 | 98.8 | 101.1 |
| Power | 21.50 kW | 23.05 kW | 23.80 kW |
From 12,000 to 17,500, delivery ratio is 3.5 to 5.9 % higher at 1.60 and 6.0 to 8.3 % lower at 1.35, at every point. That fits the usual explanation: a smaller case reaches a higher pressure before the transfers open, so it moves more mixture each cycle. These runs show the delivery ratio moving with the setting; they don't measure the case pressure.
Delivery ratio counts what comes in through the intake, not what ends up in the cylinder. The trapped-gas row is everything in the cylinder when the exhaust port closes, including burnt gas left from the cycle before. At 15,000, 1.60 takes in 4.9 % more than the baseline, and the total gas trapped is 2.4 % more. The CSV's trapped_
Pumping harder also costs more. The CSV's crankcase_
These runs don't say why the higher case compression comes off the pipe sooner. The drop looks the same in all three: power falls by 60 to 62 %, the total gas trapped in the cylinder falls to about 52 mg and peak cylinder pressure halves.
What to take from it
On this model, with this engine and the same pipe, changing only the case compression:
- 1.60 (42 cc less case) added 2.5 to 3.8 % at every point from 12,000 to 17,500 and 2.0 % at the peak, and came off the pipe one 250 rpm step sooner. At 17,750, still on the pipe, it was 3.3 % ahead.
- 1.35 (77 cc more case) lost 4.8 to 6.9 % at every point from 12,000 to 17,750 and 3.4 % at the peak, was still 4.7 % behind at 18,000, and stayed on the pipe one step longer.
- Delivery ratio moved with the setting, at every rpm from 12,000 to 17,500; the total trapped gas and the power moved less.
- “Lower favours top end” held only as “stays on the pipe a little longer”. While the baseline was on the pipe, 1.35 never made more power.
That's one engine and two values. To try yours:
- Start from your own engine (the setup wizard, tutorial 1), sweep it, then change only Case compression. Use the table above to turn a volume you've measured or taken out into a ratio.
- Compare at the same rpm, with the baseline set (Compare two pipes shows how).
- If the drop is what matters, check it with a finer sweep before you use it.
- For the pipe's part in where the engine comes off the pipe, How an expansion chamber works explains what the chamber does.
- For the pipe on this same engine, Kart flex length makes the header a quarter and half an inch longer and half an inch shorter, and shows what each does to the power and to where it comes off the pipe.
These are simulated estimates from a 1D gas-dynamics model of a generic engine, not measurements, and not your engine. The model isn't calibrated against a dyno, and even the differences between the runs hold only for this model. Case compression here changes the case volume and nothing else; the reed is the app's ideal valve. The model shows falling off the pipe as a sharp step, sharper than a real dyno would. Nothing here says how an engine will ride or race. Use WaveDyno to compare designs and to see what changes where, and confirm on a real dyno before building. See the Terms of Service, section 4.