Raise the transfer ports on a 125 two-stroke: what 1.5 mm does to blowdown and the powerband
Tutorial 11 · about 10 minutes plus four sweeps
Raise the transfer ports and they open sooner and close later: more transfer duration, more time for fresh charge to come up from the crankcase. The price is blowdown. The exhaust opens a fixed number of degrees before the transfers do, and every degree the transfers gain comes out of that gap. Forum threads disagree about how much blowdown an engine needs and what a raise does to the powerband.
This guide raises the three transfer ports of the app's 125 cc moto-X engine by 1.5 mm, then by half that, then raises the exhaust as well to give the blowdown back. It reads what moves.
The short answer, in this model: raising the transfers 1.5 mm changed the power by less than 0.5 kW from 10,250 to 12,500 rpm, but the engine fell off the pipe 1,000 rpm sooner. The pipe hadn't changed, and the app's tuned ≈ badge went up. Raising the exhaust as well gave the blowdown back and put the drop 500 rpm above where it started, for a big loss at the bottom.
What the page can't answer:
- How far to raise your transfers. The example is the app's 125 moto-X archetype, the engine of tutorials 1, 4, 9 and 10. It isn't a YZ125, a KTM 125 or anyone's actual cylinder, and the model isn't calibrated against a dyno. What it shows is how to find out on a model of your own engine.
- Anything about the shape of the ports. In this model each transfer window feeds the cylinder through its own 1D duct. There's no loop: the model doesn't know which way the streams point, and a window's angles only shrink its flow area (by the cosine of the angle). So this page changes when the ports open, and nothing about where they aim.
- The rings and the piston. The model has no ring or piston: a raise that a real ring wouldn't like doesn't show up here.
Everything here runs on WaveDyno's free plan with daily run limits. Each sweep has 19 points; the Run dyno button showed 16.6 units for each one. A finished sweep is charged what it actually used, up to its estimate. Depending on what you've already run today and what each sweep is charged, you may not get through them all in one UTC day. The app refuses a run whose estimate doesn't fit in what's left of the day, and the limit resets at midnight UTC. Your runs stay in the project, so you can pick up where you stopped.
The engine
Create a new project with the setup wizard (the + button, as in tutorial 1), pick 125 moto-X / enduro, keep every answer at its default and create it. On Run → Setup, set the sweep to 10,000 to 14,500 rpm in 250 rpm steps, quality Standard. That's the sweep of tutorials 4, 9 and 10.
Run it and name it baseline:
- Highest sampled point 27.129 kW (36.4 hp) at 13,000 rpm.
- On the pipe to 13,500, still 25.219 kW there.
- Off the pipe by 13,750: 12.795 kW, less than half its highest point. A 250 rpm sweep places the drop between 13,500 and 13,750, no closer.
1. Read the transfers you have
Go to Build → Ports.
The Port timing card shows the timing ring. Its centre reads Ex 188° · Tr 128°, and under that blowdown 30°: the exhaust opens at 86° after top dead centre, the transfers at 116°, 30° later. The key below the ring lists each window's duration.
The Port windows card has the exhaust windows (main and the booster pair) and, under Transfer windows, three entries: A and B are mirrored pairs and C is the single rear port, five windows in all. Each opens at 116 °ATDC and is 12.50 mm tall.
The Port map card unrolls the cylinder wall. Each window has a dimension line from the deck to its roof: the transfers read 42.09 mm.
Ports takes degrees, not millimetres. You type when a window opens, and the Port map shows the depth that gives. Changing Opens moves the roof and keeps the floor where it is, so the Height follows on its own, as when you file a roof. On this engine, near 116°, a millimetre is about 2.6°. That ratio depends on the stroke and the rod length, so on another engine don't use it: move Opens until the Port map shows the depth you want. Tutorial 4 does the same with the exhaust.
On Build → Ducts, the badge reads tuned ≈ 12900 rpm. Remember it.
2. Raise them 1.5 mm
In A, B and C, change Opens from 116 to 112. Leave everything else alone.
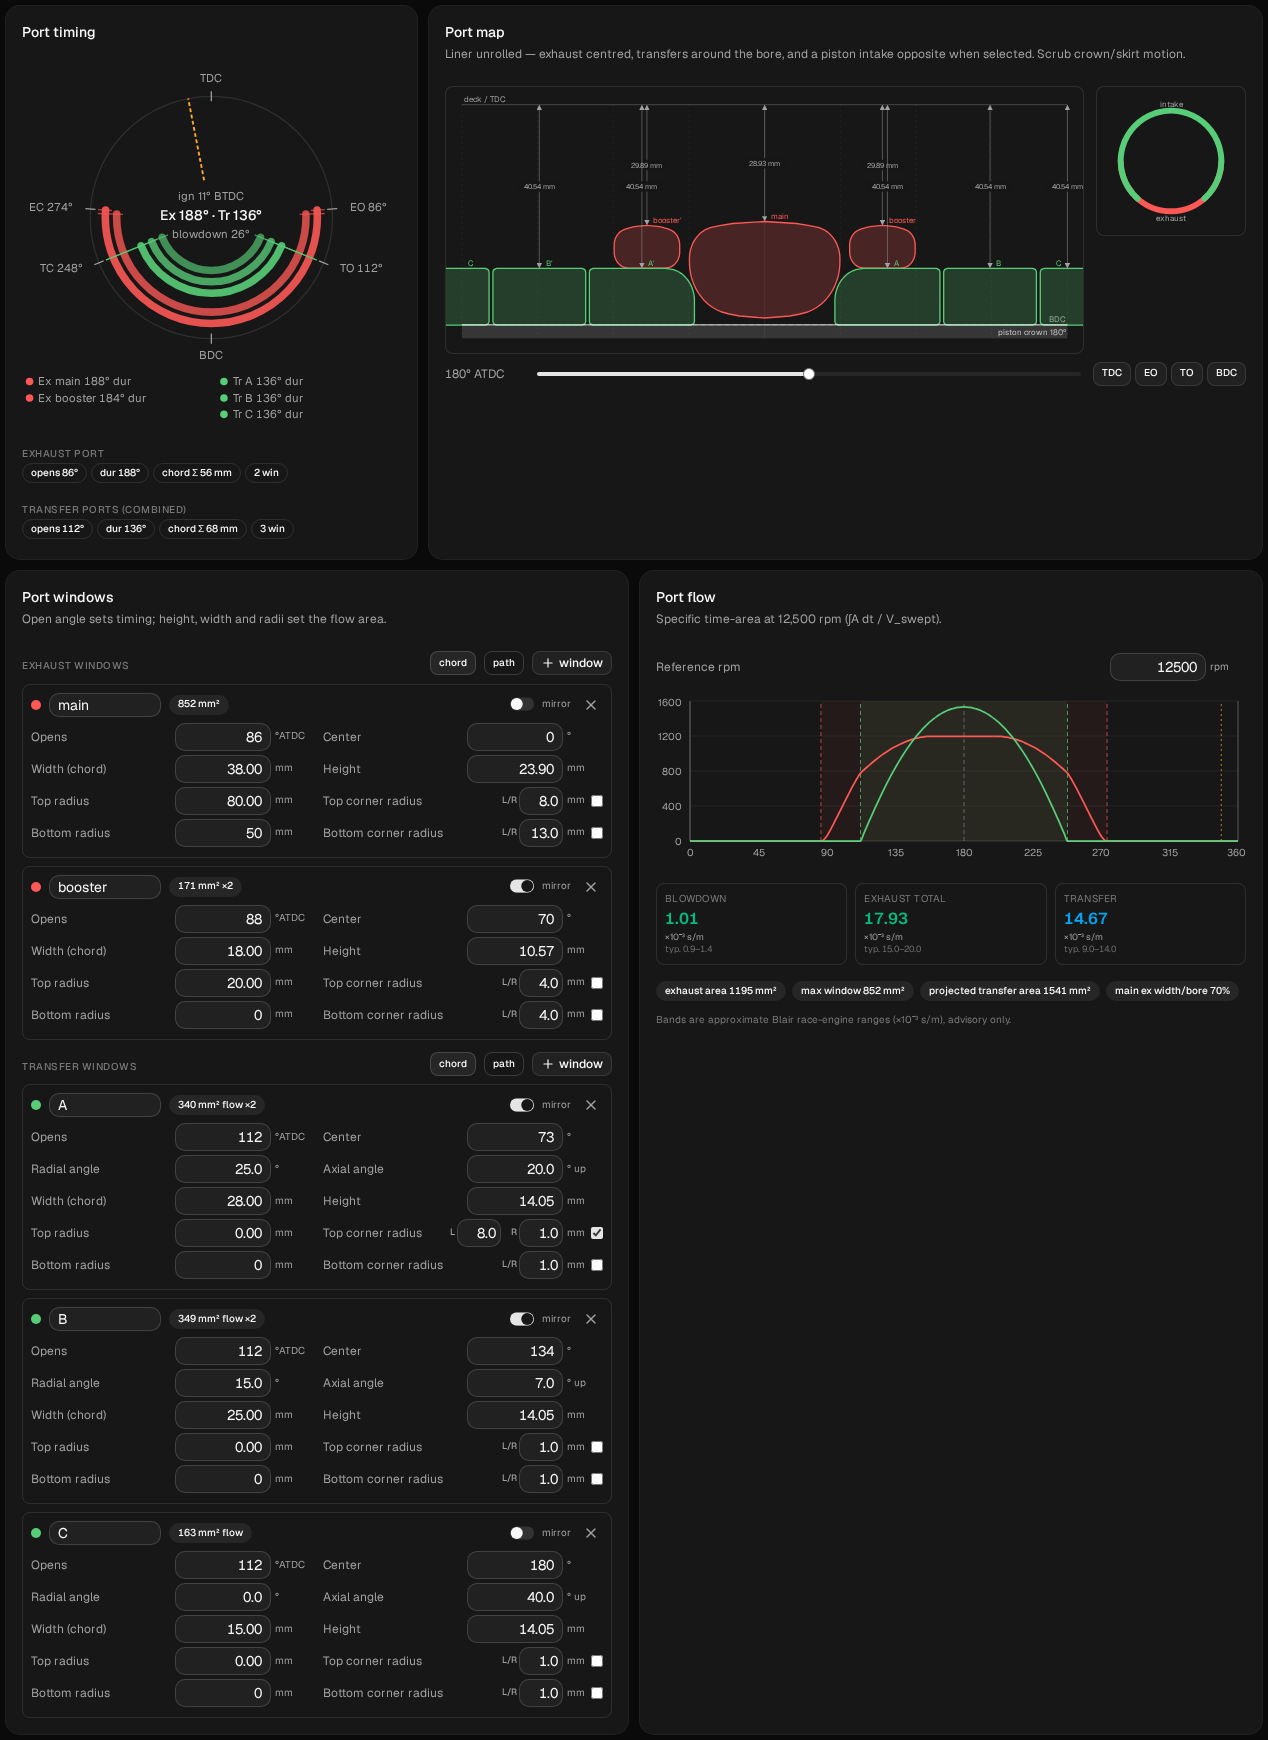
Check what changed:
- The ring reads Ex 188° · Tr 136° and blowdown 26°. The transfers now open 4° sooner and close 4° later; the exhaust hasn't moved.
- Height reads 14.05 mm on all three, and the Port map shows the roofs at 40.54 mm: 1.55 mm higher.
- The Port flow card, at its reference 12,500 rpm, puts numbers on both sides of the trade. Transfer time-area goes from 12.26 to 14.67 (×10⁻³ s/m), above the card's typical band of 9.0–14.0, so the tile turns blue. Blowdown specific time-area goes from 1.35 to 1.01, about a quarter less, still inside its band. That isn't a time: it's the open exhaust area summed over the blowdown, divided by the displacement. The blowdown itself, the time the cylinder has to empty before the transfers open, is 13.3 % shorter: 30° → 26°, or 0.400 → 0.347 ms at 12,500 rpm.
- On Build → Ducts the pipe still reads 843 mm, but the badge now reads tuned ≈ 13200 rpm. The badge works out the tuned rpm from the time between the exhaust opening and the transfers closing, and the transfers now close later. Tutorial 9 compares that badge with real sweeps.
- Compare → Diff inputs against
baselinelists seven lines, all under Transfer Port: the group's Open Angle 116 → 112, and each window's Open Angle and Height. Nothing else. (Tutorial 2 shows where Diff inputs is. Check with it, not the run description, which leaves some of the lines out.)
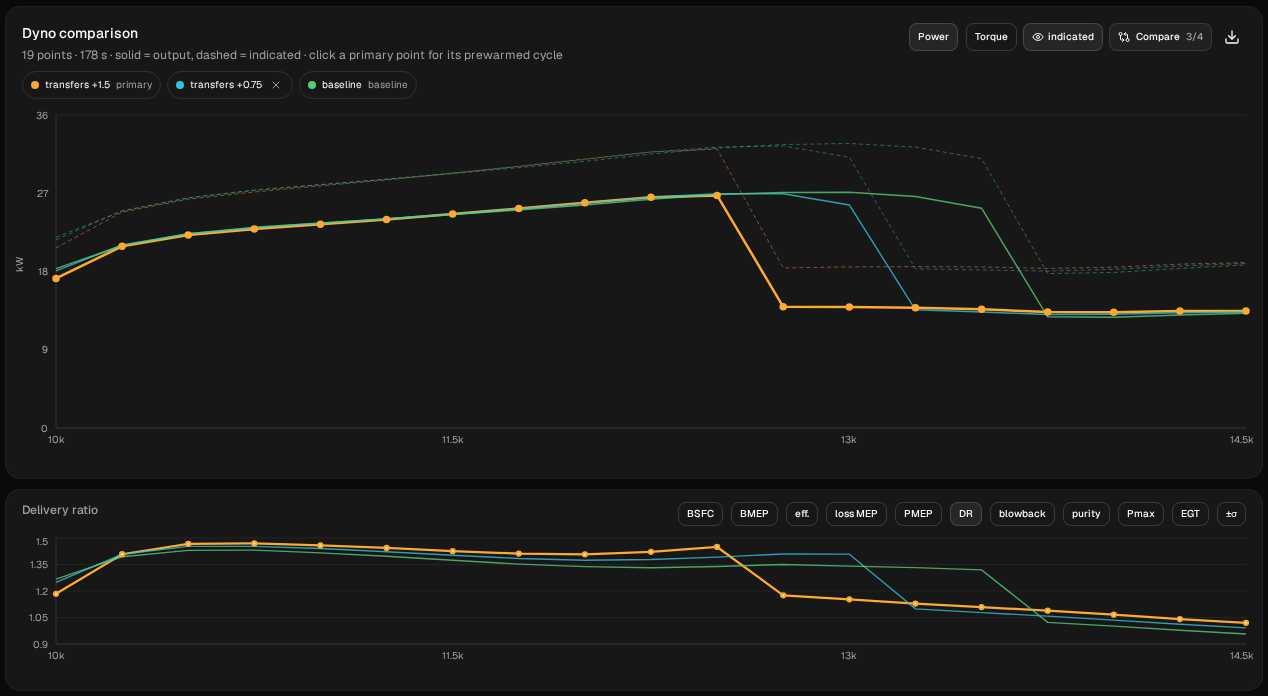
Run the sweep and name it transfers +1.5. In Compare, set baseline as the baseline.
| rpm | baseline kW | transfers +1.5 kW | change kW |
|---|---|---|---|
| 10,000 | 18.331 | 17.214 | −1.117 |
| 10,250 | 20.989 | 20.908 | −0.082 |
| 10,500 | 22.329 | 22.195 | −0.134 |
| 10,750 | 23.088 | 22.877 | −0.210 |
| 11,000 | 23.565 | 23.445 | −0.121 |
| 11,250 | 24.045 | 23.980 | −0.065 |
| 11,500 | 24.550 | 24.598 | +0.048 |
| 11,750 | 25.083 | 25.235 | +0.152 |
| 12,000 | 25.658 | 25.911 | +0.253 |
| 12,250 | 26.314 | 26.554 | +0.240 |
| 12,500 | 26.845 | 26.731 | −0.114 |
| 12,750 | 27.086 | 13.948 | −13.138 |
| 13,000 | 27.129 | 13.914 | −13.215 |
| 13,250 | 26.678 | 13.826 | −12.852 |
| 13,500 | 25.219 | 13.637 | −11.582 |
| 13,750 | 12.795 | 13.356 | +0.562 |
| 14,000 | 12.732 | 13.326 | +0.594 |
| 14,250 | 12.972 | 13.464 | +0.492 |
| 14,500 | 13.164 | 13.459 | +0.295 |
Italics: off the pipe. Every point converged in both runs.
The bottom of the sweep loses a little. At 10,000 the raised transfers make 1.117 kW less (−6.1 %), and from 10,250 to 11,500 they're within 0.210 kW of the baseline.
The middle gains a little. From 11,500 to 12,250 they're ahead, by up to 0.253 kW at 12,000. The highest sampled point moves down two steps, to 26.731 kW (35.8 hp) at 12,500, 0.398 kW below the baseline's. The baseline's top is flat, its 12,750 only 0.042 kW below its 13,000, but the raised transfers' isn't: the point after their best, 12,750, is already off the pipe. A finer sweep is needed to tell whether the peak itself moved.
The top is where the raise costs. By 12,750 it's off the pipe: 13.948 kW where the baseline still makes 27.086, and at 13,000 it's 13.215 kW behind. The drop comes 1,000 rpm sooner, between 12,500 and 12,750 instead of between 13,500 and 13,750. From 13,750 both are off the pipe, and there the raised transfers are about half a kilowatt ahead, at about 13 kW.
So the badge said the pipe would work 300 rpm higher, and the sweep says the band ends 1,000 rpm lower. The badge only knows the port timing and the pipe's lengths. What it doesn't know is the blowdown: 13.3 % shorter here, and the Port flow card's blowdown specific time-area about a quarter smaller. Neither proves why, and the model doesn't say which part of the cycle gives way first. It shows that, on this engine, the band ended sooner.
From 10,500 to 12,500, more enters through the intake without increasing the total trapped mass. After the raised-transfer run falls off, both quantities are lower. Switch the lower chart to DR. Delivery ratio measures what the intake admits into the crankcase. From 10,500 to 12,500, transfers +1.5 admits more: its delivery ratio is 0.0357 to 0.1119 higher. At 12,750 and 13,000, where it's off the pipe, it's 0.1748 and 0.1881 lower. The trapped mass in the CSV export (trapped_mass_mg, the total in the cylinder, fresh charge and burnt gas together) doesn't follow: it's lower at every point from 10,500 to 13,000, by 0.46 mg at 12,250 and by up to 53.57 mg. These columns don't show where the extra charge goes. On the EGT chart, the exhaust gas at the model's 120 mm probe is 21.8 to 168.5 °C cooler from 10,500 to 13,000.
Each sweep climbs from 10,000, and each point starts from the state the one before it left. Tutorial 10, section 3 shows that where a sweep drops off the pipe can depend on that. All four sweeps on this page climb the same way from the same rpm, so they compare like with like.
3. Half the raise
Restore baseline (Compare → its restore icon → Restore settings) and check that Diff inputs against it is empty. Then set A, B and C to 114: 0.76 mm up. The ring reads Ex 188° · Tr 132°, blowdown 28°; the Port map shows 41.33 mm, Height 13.26; the badge reads tuned ≈ 13100. Run it and name it transfers +0.75.
| rpm | baseline kW | +0.75 change | +1.5 change |
|---|---|---|---|
| 10,000 | 18.331 | −0.262 | −1.117 |
| 12,250 | 26.314 | +0.229 | +0.240 |
| 12,500 | 26.845 | +0.106 | −0.114 |
| 12,750 | 27.086 | −0.126 | −13.138 |
| 13,000 | 27.129 | −1.546 | −13.215 |
| 13,250 | 26.678 | −13.103 | −12.852 |
| 13,500 | 25.219 | −11.864 | −11.582 |
| 13,750 | 12.795 | +0.280 | +0.562 |
Italics: that run is off the pipe and the baseline isn't.
Half the raise cost much less at the bottom and moved the drop half as far. It cost 0.262 kW at 10,000, under half of what 1.5 mm cost, and from 10,250 to 12,750 it was never more than 0.229 kW from the baseline. Its highest sampled point, 26.960 kW (36.2 hp) at 12,750, is 0.169 kW below the baseline's; again, a finer sweep is needed to tell whether the peak moved. But it already sags by 13,000 (−1.546 kW) and drops off the pipe two steps sooner, between 13,000 and 13,250. Half the raise moved the drop 500 rpm; the full raise moved it 1,000.
4. Give the blowdown back: raise the exhaust too
The porter's rule is to raise the exhaust with the transfers, so the blowdown stays where it was. Tutorial 4 raised this engine's exhaust 2 mm; do that on top of the raised transfers.
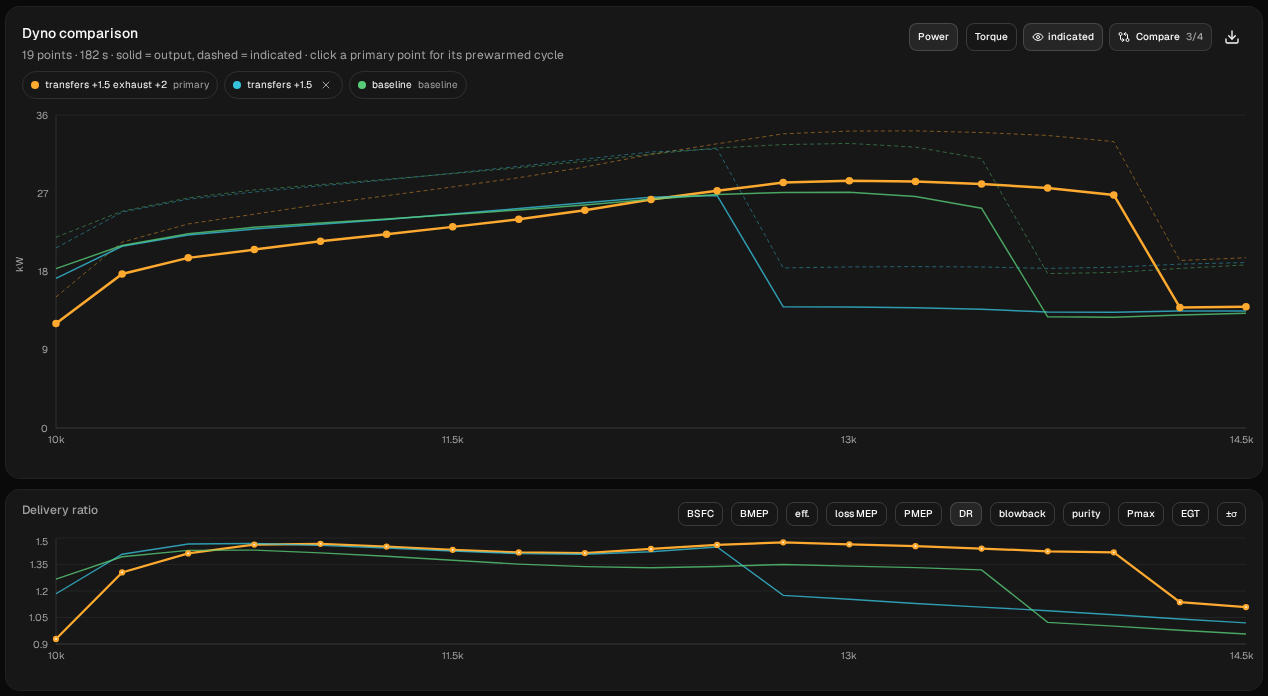
Restore transfers +1.5. In the exhaust windows, set main Opens from 86 to 81.9 and booster from 88 to 83.9. The ring reads Ex 196.2° · Tr 136° and blowdown 30.1°, almost the baseline's 30°. The Port map shows the exhaust roofs at 26.94 and 27.91 mm, and the badge reads tuned ≈ 13600. Diff inputs against transfers +1.5 lists five lines, all under Exhaust Port. Run it and name it transfers +1.5 exhaust +2.
| baseline | transfers +1.5 | transfers +1.5 exhaust +2 | |
|---|---|---|---|
| Ring / blowdown | Ex 188° · Tr 128° / 30° | Ex 188° · Tr 136° / 26° | Ex 196.2° · Tr 136° / 30.1° |
| tuned ≈ badge | 12900 | 13200 | 13600 |
| 10,000 rpm | 18.331 kW | 17.214 (−1.117) | 12.010 (−6.321, −34.5 %) |
| Highest sampled point | 27.129 kW (36.4 hp) at 13,000 | 26.731 (35.8 hp) at 12,500 | 28.427 (38.1 hp) at 13,000 |
| Last point on the pipe | 13,500 | 12,500 | 14,000 |
With the blowdown back, the drop moves up instead of down. The engine stays on the pipe to 14,000 (26.808 kW) and drops between 14,000 and 14,250: two steps later than the baseline, six later than the raised transfers alone. From 12,750 to 13,500 it makes 1.138 to 2.834 kW more than the baseline, and its highest sampled point is 1.299 kW higher.
The bottom pays for it. It's behind the baseline at every point from 10,000 to 12,250: 6.321 kW at 10,000 (−34.5 %), still 0.639 kW at 12,000. That loss is for both port changes together; tutorial 4 shows the exhaust-only comparison.
What to take from it
On this model, with this engine and this pipe:
- Raising the transfers 1.5 mm (4°, blowdown 30° → 26°) hardly moved the power below the peak (within 0.253 kW from 10,250 to 12,500, 1.117 kW at 10,000), and brought the drop off the pipe 1,000 rpm sooner.
- Half that raise was mostly harmless to the curve below 13,000 (within 0.229 kW from 10,250 to 12,750) but still moved the drop 500 rpm. Here the second 0.75 mm cost the same 500 rpm as the first.
- The tuned ≈ badge went the wrong way. It rose with the transfer timing while the band's end came down. Use it to read the port timing against the pipe; sweep to see what the engine does.
- Restoring the blowdown with the exhaust gave the top back and more, two steps past the baseline, at a large cost at the bottom.
That's one engine, not a rule. To try it on yours:
- Enter your own engine with the setup wizard (tutorial 1), sweep it, then change only the transfer Opens. Set them until the Port map shows the depth you're planning.
- Read where the band ends, not only the peak. Here the highest sampled point hardly moved, and the drop moved 1,000 rpm. If the drop matters, sweep past it, and check a move of one step, of the drop or of the peak, with a finer sweep.
- Change one thing at a time and check it with Diff inputs, as in tutorial 4. If you raise the transfers and the exhaust, run each as its own sweep first.
- Case pressure is what pushes the charge up the transfers: crankcase compression changes that instead of the timing.
These are simulated estimates from a 1D gas-dynamics model of a generic engine, not measurements, and not your engine. The model isn't calibrated against a dyno, and even the differences between the runs hold only for this model. It has no loop direction, no ring and no piston. It doesn't know whether a real cylinder can take the raise, and it says nothing about how a bike will ride.
Next: tutorial 3, step 6 went the other way on a 50 cc moped, shortening the transfers 4° for a lower band; there it only trimmed the whole curve. Tutorial 4 is the other side of blowdown: the exhaust on its own, then the pipe retuned for it.